
How to Read a Whole AliExpress Review Corpus Fast (Bulk Analysis Workflow)
How to Read a Whole AliExpress Review Corpus Fast (Bulk Analysis Workflow)
Quick answer: To assess a large AliExpress review corpus fast, read the shape of the distribution rather than individual comments. The AliShopping Tools Reviews tab gives you the star distribution across all five bands, a with-photos filter that surfaces real customer photos, and a CSV/JSON/TXT/XLSX export of the corpus — so a listing takes seconds instead of minutes. The tab does not score reviews or decide which ones are genuine; it puts the evidence in front of you and the call stays yours. This is the bulk/volume companion to the full fake AliExpress reviews guide.
Reading reviews on AliExpress one at a time is a waste of time. Reading the shape of a review distribution takes 30 seconds and tells you most of what you need to know. This is the high-volume workflow — the bulk companion to our full fake AliExpress reviews guide, focused on how to process a whole review corpus quickly rather than how to read one listing.
The Reviews tab lays out the evidence — the star distribution, the photo reviews, the exportable corpus — and your job is to read it against the red-flag framework we already published. Nothing in the tab labels a review fake or hands you a verdict; the interpretation is the part you do. Here is how to set it up, the patterns that come up most often, and the per-product workflow you can replicate.
1. The setup — which listings to run this on
The listings where this pays off most are mid-volume ones. Category leaders with tens of thousands of reviews are hard to skew — no single manipulation push dominates a corpus that size. Listings in the low-hundreds range are the tier where review farming has the highest visibility-impact ratio, and where a burst or a country concentration actually moves the star average.
Pick a handful of listings you are genuinely considering — ideally across a couple of categories so you develop a feel for what a normal distribution looks like in each — and run them back to back. Doing several in one sitting is what trains the pattern recognition; the second listing is much faster than the first.
Open each AliExpress page, click the Reviews tab in AStools, and work through four reads:
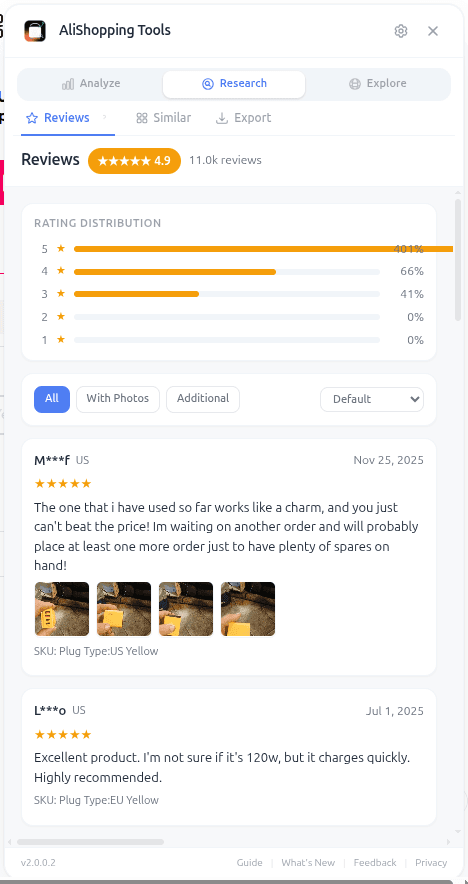
- Rating distribution — what percentage of the corpus sits at 5/4/3/2/1 star? The tab breaks this out for all five bands.
- Photo reviews — switch the filter to With Photos and look at what real buyers actually photographed.
- Posting dates — AliExpress stamps every review with a date; scroll the list and look for reviews bunching into one narrow window.
- Reviewer countries — AliExpress also shows where each reviewer is, so a corpus dominated by one market is visible as you scroll.
The first two come straight off the tab. The last two you read off AliExpress's own review list — the tab does not compute them for you, and it does not produce an authenticity score or a fake/genuine label for any review. If you want to work through the corpus outside the browser, the tab exports it in CSV, JSON, TXT or XLSX.
2. What to record per product
Keep a running note per listing — product, review count, average rating, which of the four reads tripped, and the dominant pattern. That is the whole output. You are not producing a precise fake-review percentage; you are producing a comparative read across the listings you are choosing between.
The important thing the note surfaces is the spread. Listings sitting side by side in the same category, at the same price, with near-identical star averages, routinely look completely different once you read their distributions. Some are clean. Some trip three of the four reads. Average rating alone cannot tell them apart — which is precisely why it is the worst single signal of review trustworthiness. The listings that should worry you most are the ones where the star average looks excellent (4.8-4.9) and the underlying distribution is obviously engineered.
We do not publish a headline "X% of AliExpress reviews are fake" figure, because we have not run a study rigorous enough to support one, and the honest answer is that it varies enormously by listing, category, and seller. Any source quoting you a single confident percentage for the whole platform is guessing.
3. The four patterns that hit most often
Four patterns dominate the flag set in practice. Each is worth walking through, because the visual signature is what makes it detectable in seconds.
Pattern 1: Rating distribution that is too clean to be real
A real product with 200 reviews will look something like 60% 5-star, 25% 4-star, 10% 3-star, 5% lower. There will be at least some 1-star reviews — usually 1-3% — from buyers who got a defective unit, ordered the wrong size, or received a damaged package. The distribution will be skewed positive but it will not be 95% 5-star.
A meaningful share of the listings you check will show 95%+ 5-star ratings with effectively no 3-star or below. That distribution shape is statistically nearly impossible at scale unless reviews are being filtered, suppressed, or planted. The Reviews tab histogram makes it visible in 2 seconds — a single tall bar at 5-star and four near-empty bars at 4-star and below.
For the deeper framework on what an authentic distribution looks like, our fake reviews guide covers the seven red flags in detail, and the how to analyse AliExpress reviews free walkthrough shows the manual workflow if you do not have AStools installed.
Pattern 2: Burst posting in the review dates
Real review accumulation is lumpy but trends. A product launched six months ago should collect reviews steadily, with seasonal bumps. A product where most reviews land in a single two-week window has been targeted by a review-farming push.
Burst windows are the most common flag of the four, and some listings show several — typically aligned with product-listing promotion pushes from the supplier. Nothing plots this for you: read the dates on AliExpress's review list, or export the corpus from the Reviews tab and look at it outside the browser. A burst is obvious once you see how many reviews share the same handful of dates.
Pattern 3: Country distribution that is concentrated unnaturally
Most legitimate AliExpress products sell to a global buyer base. Scrolling the review list, you should see a spread of reviewer countries — typically US, Brazil, Russia, France, UK, Spain, Mexico, Germany, plus a long tail. If almost everything comes from one country, two things are likely: either the product has artificial geographic targeting (which can be legitimate for region-specific items), or the reviews are being generated from a single source pool.
The flag to look for is a heavy concentration in a single country that does not match the product's stated target market. This signal is harder to manipulate than burst posting — a review farm needs accounts in specific countries to broaden the geographic spread — so concentration is often the tell that survives when the others have been cleaned up.
Pattern 4: Photo recycling and template phrasing
Photo reviews are supposed to show the product in the buyer's environment. Real photo reviews are inconsistent — different lighting, different angles, sometimes blurry, sometimes excellent. Manipulated photo reviews often reuse the same 3-5 photos across multiple "different" reviewers, sometimes lightly cropped or colour-shifted to look like new uploads.
Recycling is usually blatant once you look — the same handful of photos appearing under several different "buyer" names. The Reviews tab does not detect photo recycling, at the pixel level or any other; what it does is switch the list to With Photos and open each customer photo full-size, and scrolling that grid surfaces the repeats in under 10 seconds.
Template phrasing is the language equivalent. "Great product, fast shipping, very happy" repeated across 50 reviews with minor variation is the signature. Real reviews mention specifics — colour, exact use, a complaint, a compliment about packaging. Generic enthusiasm is template output. We covered the trust framework around this in our broader AliExpress trust hub.
4. What a heavily-flagged corpus actually means for you
Knowing a listing's reviews are largely manipulated is interesting; the practical question is what to do with it. Two angles.
For dropshippers sourcing the product: a 4.9-star average built on a heavily-flagged review corpus is functionally a different product than a 4.9-star average built on a clean one. The customer-side experience will not match the listing's review summary. Refund rates will be higher than expected. Chargeback rates will be higher than expected. The supplier may also be running thin margins to fund the review farming, which means quality control on outbound shipments is often inconsistent.
The downstream cost is real. We have walked operators through the math in our supplier risk check guide — products with high fake-review concentration also tend to have above-average dispute rates, and dispute rate is a leading indicator of how much you will lose to refunds and chargebacks at scale.
For dropshippers researching whether to test the product: the review-trust signal goes into the same bucket as saturation, trend phase, and supplier risk. None of these signals is a sole-veto on a product, but a product that fails on review trust + saturation + trend phase + supplier risk is a product whose underlying economics do not work for late entrants. Reading the four signals in 30 seconds saves you the test budget that would have been burned learning the same thing the slow way. The full pre-source checklist sits in our supplier risk checklist — review distribution is one of seven items; the others are equally fast to verify.
5. The per-product workflow
This is the workflow to run per product. It settles into well under a minute per listing after the first one, once you stop having to think about what to look at.
- Open the AliExpress product page.
- Click the Reviews tab in the AStools sidebar.
- Look at the star distribution. Is 5-star overwhelming the corpus with almost nothing at 3-star and below? Flag.
- Switch the filter to With Photos and scroll the photo grid. Are the same images repeating under different buyer names? Flag.
- Scroll the review dates. Are most of them bunched into one narrow window? Flag.
- Scroll the reviewer countries. Is one market dominating a product sold globally? Flag.
If any 2 of those 4 trigger, treat the corpus as one that is not accumulating organically, and either skip sourcing the product or investigate the supplier side before committing budget. That is a judgement you are making from the evidence — no part of the extension makes it for you.
That is the entire workflow. The tab lays out the count, the distribution and the photos, and exports the corpus if you want a copy; the pattern recognition is yours. Run it across a batch of candidate listings and you get a comparative trust read on all of them in the time it would take to read the reviews on one — and the corpus-level read is the more rigorous of the two, because it looks at the whole listing rather than at whichever reviews AliExpress surfaced first.
Install AliShopping Tools free from the Chrome Web Store — the Reviews tab is in the default panel set and runs on every AliExpress product page automatically. No account, no signup, no per-product fee.
Most operators ignore review distribution entirely because the average-star rating looks fine. Average-star is the worst signal precisely because it is the easiest to inflate. The four corpus-level signals are dramatically harder to manipulate all at once, which is why reading them together catches what reading the rating average alone cannot.
— Daniel
Disclosure: This article is published by AliShopping Tools and describes a workflow, not a published study — we do not quote a platform-wide fake-review rate because we have not measured one. All signals described are read from publicly visible AliExpress review data. The 7-red-flag framework cited is documented in our fake reviews guide. Email feedback via contact page.
All trademarks referenced are the property of their respective owners. This guide is for educational purposes and is not financial advice.
Ready to find winning products?
Try AliShopping Tools — 15 free AI tools for product research.
Quick answers
Frequently Asked Questions
1How do you analyze a large batch of AliExpress reviews quickly?
Open the listing in the AliShopping Tools Reviews tab.
It gives you the total review count, the rating distribution across all five star bands, filters for All, With Photos and Additional reviews, real customer photos that open full-size, and an export of the corpus in CSV, JSON, TXT or XLSX.
You read the shape of the corpus instead of reading review bodies one by one, which is what makes working through a batch of listings in one sitting practical.
The tab does not score reviews or label any of them fake — it shows the evidence and you make the call.
2What percentage of AliExpress reviews are fake?
There is no trustworthy published figure, and any single percentage should be treated with suspicion — it varies enormously by listing, category, and seller.
What is consistent is the pattern: on listings where the red flags stack up (burst posting, template phrasing, country concentration, near-zero photo reviews), a substantial share of the review corpus looks manipulated, while comparable listings from established sellers look clean.
Flagged patterns are not proof that a review was paid for; they indicate a corpus that does not behave like organic accumulation.
3What are the four most common fake review patterns on AliExpress?
Burst posting (many reviews landing in a single narrow window), rating distribution anomalies (suspiciously high 5-star concentration with almost nothing below 4 stars), country concentration (the majority of reviews from a market the seller does not primarily serve), and a near-zero photo-review ratio despite a high total review count.
The rating distribution and the photo reviews are what the Reviews tab puts in front of you; posting dates and reviewer countries you read off AliExpress's own review list as you scroll.
4Does reading reviews help evaluate AliExpress suppliers?
Reviews are one data point among several.
A supplier with thousands of reviews whose distribution looks engineered is less reliable than a supplier with far fewer reviews, a natural spread across star bands, and a low dispute rate.
Weigh what you read in the review corpus against supplier dispute rate, store age, and risk score for a complete quality picture.
More from the blog
I Spent $1,000 Testing 12 AliExpress Products. Here's the Spreadsheet.
A dropshipping product testing case study 2026 — 12 AliExpress products, $1,000 ad spend, 1 winner. Full modelled P&L plus the signals I checked at decision time.
Are Viral TikTok Gadgets Worth Buying? How to Tell Before You Spend
A viral TikTok gadget isn't automatically worth buying. Learn the buyer-side signals — order history, seller rating, price history, demo vs reality — that tell you before you spend.
How to Do Product Research for Dropshipping: 7-Step Framework (Free Tools, 2026)
A repeatable 7-step product research framework for dropshippers in 2026 — from idea sourcing to live testing, using only free tools. No Ecomhunt subscription needed.