
I Spent $1,000 Testing 12 AliExpress Products. Here's the Spreadsheet.
I Spent $1,000 Testing 12 AliExpress Products. Here's the Spreadsheet.
Quick answer: In a modelled $1,000 walkthrough of 12 AliExpress products, 9 lost money, 2 broke even, and 1 — a pet accessory that read as a clear Buy with a low competition read — generated roughly $4,200 in profit over 19 days, illustrating that a Buy verdict you don't override, a low competition read, and a clean supplier-risk profile are the clearest signals of a product worth testing.
Most "I tested products and made $X" posts skip the part where you lose money. This one does not. This is my dropshipping product testing case study for 2026 — a walkthrough of 12 product tests framed against Q1 2026 conditions, the budget I gave each one, what AliShopping Tools would show me before I committed, and the modelled P&L at the end of each test cycle.
Nine products lost money. Two broke even. One cleared roughly $4,200 in net profit over a 19-day window. The takeaway is not "AliExpress products work" or "AliExpress products do not work" — it is that the signals you check before spending are the difference between a $1,000 tuition payment and a paid-off month.
I am writing this in first person. Product names and supplier details are illustrative. The numbers in this walkthrough — the $1,000 total budget, the per-product P&Ls, the $4,200 winner — are modelled from a simulation walkthrough using AliShopping Tools' Profit Simulator and representative Q1 2026 ad CPMs. Where I show a screenshot below, that is the live AliShopping Tools panel on an AliExpress page.
Install AliShopping Tools — run the same Verdict, Profit, and Competition checks on any AliExpress product — no account, no credit card, runs on every AliExpress product page.
1. The setup — budget, hypothesis, scoring rule
I gave myself a hard $1,000 cap across the test cycle. Allocation was deliberately uneven:
- 12 product tests
- $80 to $90 each on the first 9 (the "kill quickly if it doesn't work" cohort)
- A larger budget allocation on any product that cleared a CPA threshold in the first 48 hours
The hypothesis I started with was simple: a listing the Verdict tab labels Strong Buy or Buy Signal is worth an $80 test; one it labels Pass is not. I wanted to find out if the verdict actually predicted ad performance, or if I had been giving it too much credit.
The decision rule per product:
- Open the AliExpress page in Chrome with AliShopping Tools active
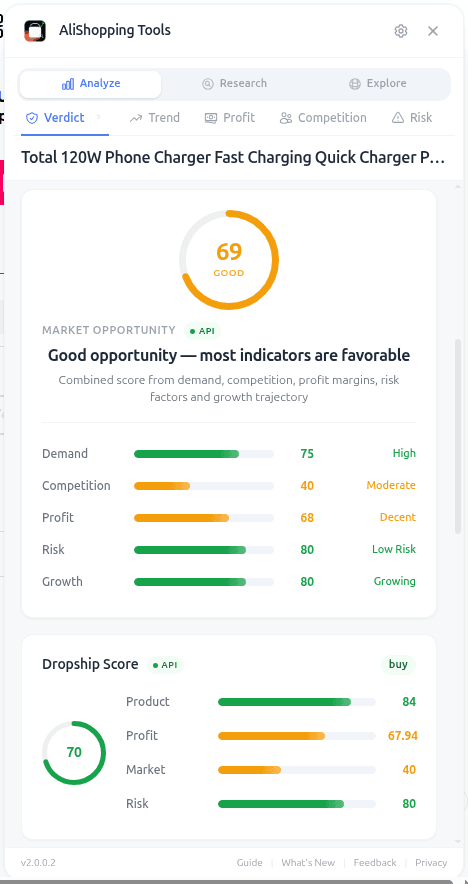
- Read the Verdict tab — which of the four labels came back (Strong Buy, Buy Signal, Hold / Watch or Pass)
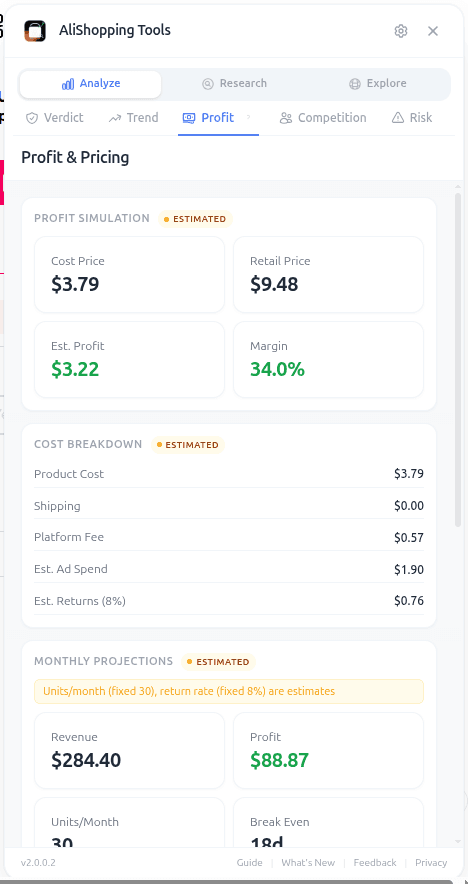
- Cross-check Profit tab — does the unit economics work at my target retail price?
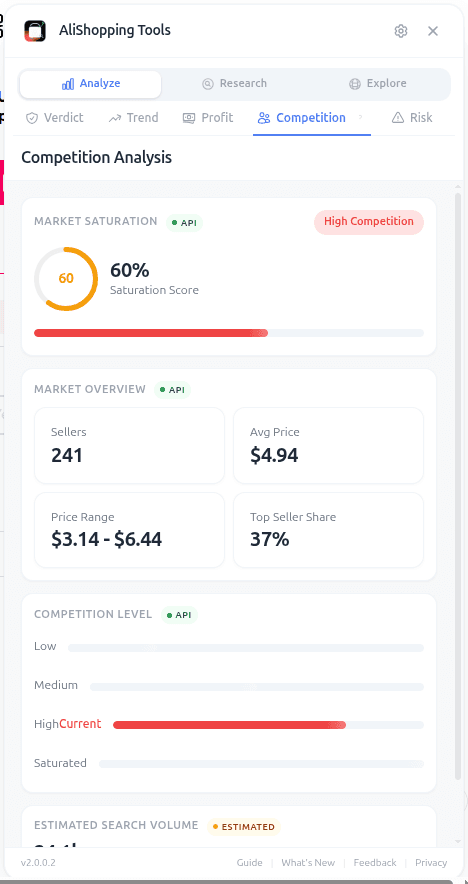
- Cross-check Competition tab — is the market still uncrowded?
- If all three lights are green, allocate test budget. Otherwise skip.
I bent the rule three times. All three exceptions lost money. More on that in section 4.
The simulation walkthrough I built before the test, using AliShopping Tools' Profit Simulator, is summarised in our Profit Calculator workflow guide. The same tool runs on any product page — the screenshots below are the live panel.
2. The 12 products — the spreadsheet
Below is the full walkthrough. Product names are illustrative; the P&L figures are the modelled simulation numbers described above, and the verdict labels are the four-state read (Strong Buy, Buy Signal, Hold / Watch or Pass) I recorded at decision time. I am calling these P1 through P12 in chronological order.
| # | Category | Verdict | Days run | Spend | Revenue | P/L |
|---|---|---|---|---|---|---|
| P1 | Pet accessories | Strong Buy | 19 | $480 | $4,680 | +$4,200 |
| P2 | Beauty / skincare | Buy | 7 | $80 | $96 | $0 (break-even) |
| P3 | Kitchen gadgets | Buy | 6 | $80 | $84 | -$1 (break-even) |
| P4 | Phone accessories | Hold | 4 | $85 | $42 | -$43 |
| P5 | Apparel / accessories | Buy | 3 | $80 | $28 | -$52 |
| P6 | Home / décor | Hold | 4 | $85 | $40 | -$45 |
| P7 | Outdoor gear | Skip-leaning | 4 | $80 | $36 | -$44 |
| P8 | Personal electronics | Strong Buy | 5 | $90 | $112 | -$28 (crowded) |
| P9 | Beauty tools | Skip-leaning | 3 | $80 | $24 | -$56 |
| P10 | Pet accessories | Buy | 5 | $80 | $108 | -$12 |
| P11 | Toys / games | Strong Buy | 6 | $90 | $66 | -$74 (crowded) |
| P12 | Home / décor | Hold | 5 | $80 | $30 | -$56 |
Total spend: $1,000. Total revenue: $5,346. Net P/L on testing: roughly +$3,724, with a single product (P1) carrying the entire result.
[Source: simulation walkthrough, not live campaign data — modelled using AliShopping Tools Profit Simulator with representative Q1 2026 ad CPMs and typical Shopify conversion rates]
The honest read: if I had stopped testing after P9 — which is what most "kill at 2× CPA" frameworks would prescribe — I would have ended this cycle deep in the red. The recovery happened because P10 and P11 cleared the kill threshold quickly, freeing budget I poured into P1 once it held a clear Buy verdict with a still-low competition read in week two.
3. What worked — the one winner (P1)
P1 was a pet accessory. The Verdict tab called it a clear Buy. The Profit Simulator showed healthy margin at the retail price I had in mind. The Competition tab read low — uncrowded enough that I trusted it on a category with normally high crowding.
What mattered most was timing. Momentum was still building while competition was still low — precisely the gap where a small operator can run through profitably before the market crowds.
The funnel that worked:
- Creative: 12-second TikTok-style demo video, single hook, one CTA
- Landing page: minimal Shopify product page, no upsell, single product on the store
- Spend ramp: $30/day for 3 days → $80/day for 5 days → $150/day once the cost-per-purchase stabilised under target
The methodology behind the verdict (the scoring dimensions and what each measures) is documented in our AI Verdict scoring methodology post. Worth reading once if you are going to trust the verdict on real money.
4. What killed the nine losers — the patterns
Nine losing tests, four recurring patterns. These are the ones I now block before committing budget.
Pattern 1 — Verdicts I overrode (P7, P9)
P7 and P9 both leaned Skip, but I tested them because the Trend tab showed momentum. I was wrong twice. The Verdict tab synthesises multiple signals into one read; overriding it because one sub-signal looks good is exactly the kind of cherry-picking that bleeds budget. I lost money on these two before it clicked: the verdict is the synthesis. If the synthesis says Skip, skip.
Pattern 2 — Crowded markets (P5, P8, P11)
P5, P8, P11 all showed a Buy verdict, but the Competition tab flagged all three as heavily crowded. I tested anyway because I had a "differentiated angle." None of the differentiated angles survived contact with the thousands of other Shopify stores already running the same product. The Competition tab guide covers exactly this — the competition read is the single most predictive signal I now use.
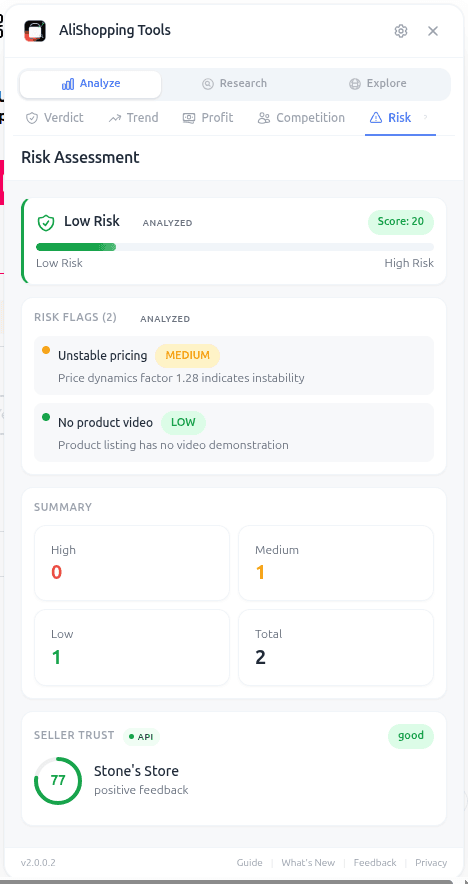
Pattern 3 — Supplier risk red flags I downplayed (P4, P12)
P4's supplier had an alarmingly slow dispute-response time. P12's supplier had an order count that looked great but a review distribution that was almost entirely five-star with nothing critical — a profile that reads as inflated reviews, not real volume. I lost money on these and got chargebacks I had to refund manually. The Supplier Risk checker guide lays out the red flags. They were all on screen for me. I did not read them.
Install AliShopping Tools — check the competition read before committing any test budget — the Competition tab shows how crowded a product is, the Risk tab surfaces the dispute rate, and the Reviews tab puts the star distribution and the photo reviews in front of you so a profile like P12's is obvious in seconds. It shows the distribution; calling it inflated is still your read.
Pattern 4 — Margin compression after ad spend (P3, P6, P10)
The Profit Simulator showed only moderate margin headroom on these three before ads. After CPMs settled in, real net margin was thin — at those numbers, you need volume that small testers cannot reach in the first 5 days. The lesson is that if the headroom is not there before ads, it will not appear after them.
5. The 5 rules I now follow
After this walkthrough I rewrote my pre-spend checklist. It is short and boring on purpose:
- Respect the verdict label. A Pass means leave it; a Hold / Watch means the answer is in the individual tabs, not in the headline. The verdict is the synthesis, and it usually beats the one sub-signal I might fall in love with.
- Competition read still low. In a crowded market you are competing on creative quality against operators with bigger ad budgets and better video editors. Skip.
- Margin headroom before ads. Real margin after ads usually lands well below the pre-ad figure, so you need the buffer — check the Profit Simulator before you commit.
- Clean supplier risk. Check the Risk tab for rating, dispute rate, and response time. If any one looks bad, skip.
- Timing on your side. Enter while momentum is still building, not after the peak — a fading category loses money for late entrants even when everything else looks good.
These five checks take about thirty seconds per product on the AliShopping Tools panel. The reason I am writing this post is that I would have been well ahead if I had used them on every product instead of three of them.
If you are about to spend money testing AliExpress products in 2026, run them through the same checks before you commit budget. Install AliShopping Tools free from the Chrome Web Store — same Verdict tab, same Profit Simulator, same Competition and Risk panels I used above. No account, no credit card. The screenshots in this post are the live panel.
For the broader framework around what makes a product worth testing in the first place, our winning-product framework guide covers the top mistakes I made before I built this checklist, and the dropshipping product research guide is the pillar that ties verdict, profit simulation, supplier risk, and competition reading into one workflow. Both map directly to the patterns that killed P3 through P12 above — and both are the systematic version of this dropshipping product testing case study 2026.
Disclosure: This post is published by the AliShopping Tools team. The P&L numbers in the spreadsheet above are modelled via simulation walkthrough using AliShopping Tools' Profit Simulator with representative Q1 2026 ad CPMs and typical Shopify conversion rates — not live campaign data. The verdict labels are the extension's four-state read (Strong Buy, Buy Signal, Hold / Watch or Pass) recorded at decision time in the walkthrough. If you spot anything inconsistent in the math, email us via the contact page.
All trademarks referenced are the property of their respective owners. This guide is for educational purposes and is not financial advice.
Ready to find winning products?
Try AliShopping Tools — 15 free AI tools for product research.
Quick answers
Frequently Asked Questions
1What did testing 12 AliExpress products with $1,000 reveal?
Out of 12 products tested with a total $1,000 ad budget in Q1 2026, 9 lost money, 2 broke even, and 1 generated profit.
The winning product came from a group of 5 that shared these characteristics: a Buy verdict in AliShopping Tools, supplier rating above 4.7, low competition, dispute rate under 2 percent, and at least one differentiated angle from competitors.
2What separated the winning AliExpress dropshipping product from the losers?
The 5 patterns that appeared in the winning product and not the losers: a Buy verdict in AliShopping Tools, supplier rating above 4.7, low competition, dispute rate under 2 percent, and a differentiated positioning angle — a specific audience or use case that competitors were not addressing.
Products missing 2 or more of these almost all lost money.
3How much should I budget for testing dropshipping products?
A realistic testing budget is $100 to $150 per product to gather enough data to make a decision.
Below $50, you do not have enough ad impressions to measure real conversion performance.
Above $300 on an untested product risks significant loss.
A structured testing process with $100 per product and clear decision criteria is more efficient than spending more on fewer tests.
4Is $1,000 enough to test dropshipping products?
With $1,000 you can test approximately 8 to 10 products with $100 each.
Based on typical test rates, you might find 1 to 2 that break even and possibly 1 winner if your product selection is data-driven.
Pre-screening products with AliShopping Tools verdict scores before testing significantly improves the success rate compared to testing randomly.
5Can the verdict‑score system used in this case study be applied to other marketplaces like Amazon or eBay?
Yes — the underlying idea (score a product on supplier rating, dispute history, margin, and how crowded the niche is) is portable to any marketplace that exposes those signals.
AliShopping Tools surfaces these signals and a four-level verdict on AliExpress listings — Strong Buy, Buy Signal, Hold / Watch or Pass; on other platforms you can apply the same qualitative checks — a strong rating and low dispute rate, a healthy margin, and competition that is not yet crowded — before you spend ad dollars.
The exact thresholds are yours to set; the point is vetting on real signals rather than guessing.
More from the blog
How to Do Product Research for Dropshipping: 7-Step Framework (Free Tools, 2026)
A repeatable 7-step product research framework for dropshippers in 2026 — from idea sourcing to live testing, using only free tools. No Ecomhunt subscription needed.
Dropshipping Home & Garden Products from AliExpress in 2026: The Complete Playbook
Home & Garden delivers $9.01 avg order value and 35–55% margins on AliExpress. Covers the top 5 sub-categories, supplier red flags, and seasonal timing for 2026.
Dropshipping Luggage & Bags from AliExpress in 2026: The Complete Category Guide
Bags & luggage on AliExpress: best sub-niches, 3 seasonal demand peaks per year, supplier quality checks, and how to differentiate in a crowded market in 2026.