
5 'Winning' Products That Are Actually Losing Money in Q2 2026
5 'Winning' Products That Are Actually Losing Money in Q2 2026
Quick answer: Five products dominating Q2 2026 winning-product roundups have all become crowded within weeks of publication, so late entrants face compressed retail prices, inflated CPMs, and margins far thinner than the lists imply — check the live competition read on AliShopping Tools' Competition tab before committing any budget.
Every winning-products list shipped in April 2026 is recommending the same handful of products. Some of those lists are ours. They were accurate when written. By the time you read most of them, they are not.
This is not an attack on listicle content. We publish them. They serve a real purpose — surfacing products with proven demand for operators looking for a starting shortlist. The structural problem is what happens between publication and your test cycle. A list goes live. Thousands of operators read it in the first week. Within a few weeks, competition on those exact products has climbed steeply. By the time the window you read about has passed, the unit economics that made the list compelling no longer exist for new entrants.
Below are five products that appear on multiple Q2 2026 lists, what has happened to their competition since they were first ranked, and what a new entrant would need to overcome to make them work today. All five are a hard sell for a typical late-arrival operator at the time of writing.
Install AliShopping Tools — check live competition before your next test — the Competition tab shows how crowded a product is on every AliExpress product page.
1. The structural problem with winning-product lists
Lists ship a static reading. Competition moves daily. The arithmetic of why this matters is straightforward:
- A product that is still uncrowded, with healthy margin, works. Test budget recovers quickly and profitable scaling can begin soon after.
- The same product once it is crowded has a different equilibrium. The retail price compresses (more sellers undercut). Ad CPMs climb (more advertisers bid the same audience). Real margin after ads drops sharply. A test cycle that broke even quickly when the product was fresh now needs far more volume to break even, and that volume is being competed for by hundreds of other Shopify stores.
The fix is not to stop reading lists. The fix is to verify the current competition reading on every candidate before committing budget. AliShopping Tools surfaces this on the Competition tab on every AliExpress product page, read live, not from a month-old article.
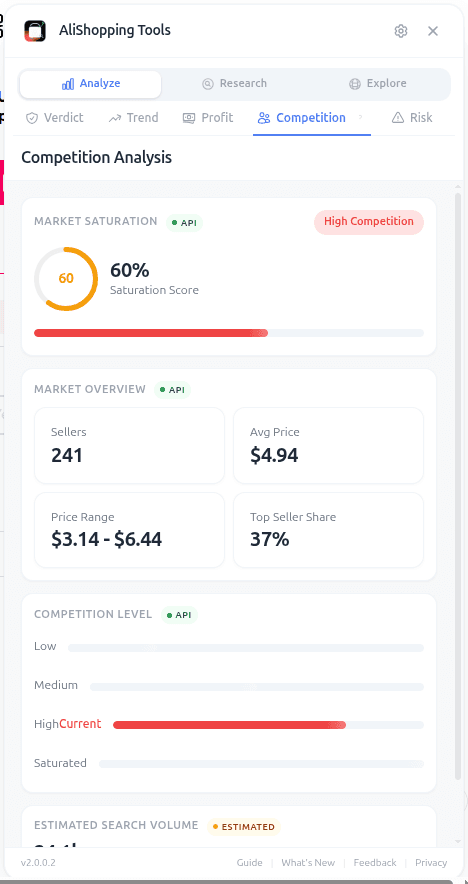
How the Competition tab reads crowding
The Competition tab reads how crowded a product is from the signals visible on the listing and around it — chiefly:
- Supplier spread on AliExpress — how many distinct AliExpress suppliers list the product or close variants, and how fast that is growing. A product whose supplier count is climbing quickly is heading toward a crowded market faster than one that is flat.
- Reseller adoption — whether new storefronts are picking the product up as a featured item. Rising adoption means new operators are piling in, sometimes faster than buyer-side demand is growing.
- Ad pressure — signals that CPMs on the audiences typically targeted for the category are rising. When ad prices climb faster than the category's underlying demand, late entrants pay more for the same eyeballs.
Treat the Competition tab as a read of relative crowding, not a precise figure to bank on. Whether a market is "too crowded" depends on your creative edge and budget — a solo tester without a creative-volume advantage feels crowding sooner than a large store does. Always verify against the live reading on your specific product before allocating budget.
The point of the five products below is not a measured percentage; it is that the competition read has clearly moved against new entrants since these products were first ranked. Open each product page today and the panel tells the same story.
2. Product 1 — Bladeless portable neck fan
The pitch in April lists: bladeless design, photogenic, summer-season demand, mid-tier margin. Most lists ranked it as a low-competition summer pick.
Today's read: heavily crowded. New-seller adoption has outpaced buyer demand — the supplier count for bladeless neck fans has climbed sharply since the start of the year, even as orders keep rising.
What a new entrant would need: a creative angle the many established stores selling this product have not already run. Festival angle is taken. Subway-commuter angle is taken. The honest answer is that most operators entering this niche today are competing on creative volume against established stores with creative pipelines, and CPMs have risen since the start of the year.
Our take for a new entrant in May 2026: skip. Competition has crossed the point where solo testers cannot win on creative budget alone.
3. Product 2 — UV-C sanitiser wand
The pitch in April lists: post-pandemic hygiene category, "science" angle in creative, low-competition finding from Q1 2026 reports.
Today's read: crowded. This is the cleanest example of a list-driven pile-in we have seen. Q1 reports treated the category as uncrowded. Within weeks of several major dropshipping channels recommending it, both the AliExpress supplier count and the Shopify seller count climbed steeply.
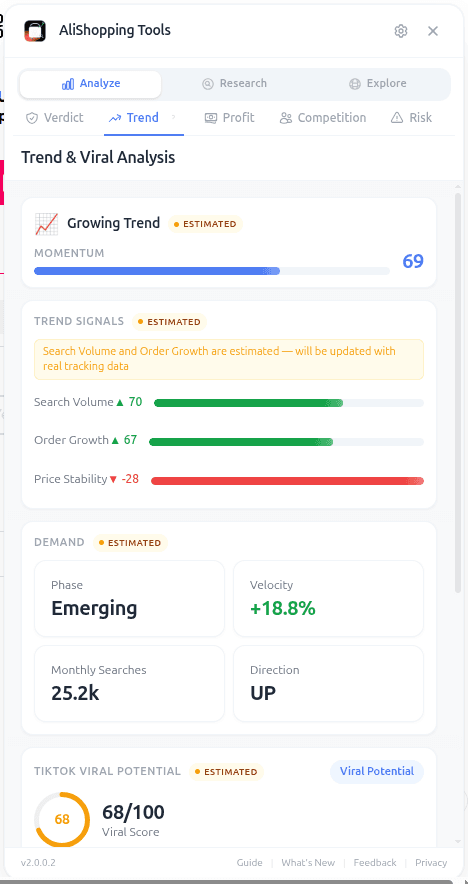
The signal that should have flagged this earlier: on the Trend tab, momentum had clearly cooled while new listings kept arriving. Cooling momentum plus rising competition is the strongest "do not enter" combination we watch for. New listings showed up faster than new buyers.
Our take for a new entrant in May 2026: skip. Entering a fading, crowded market loses money predictably.
4. Product 3 — Pet cooling mat (gel, self-cooling)
The pitch in April lists: pet category, season-driven demand, photogenic content angle. Pet content historically performs above category average for organic reach.
Today's read: crowded. Pet-category competition tends to move slower than general categories — pet buyers are loyal to specific creators, not specific products — but the cooling-mat sub-niche has become crowded enough to make it expensive for new entrants, and the margin a new operator can realistically claim has thinned considerably since the start of the year.
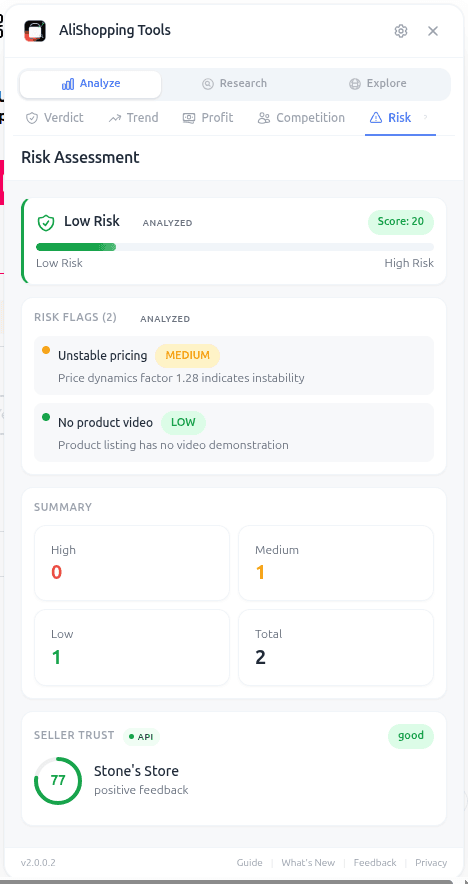
The risk signal nobody mentions on the lists: dispute rates on the busiest supplier listings run well above the safe threshold. Dispute rates climb when sellers ship inconsistent quality at scale, which is exactly what happens when a supplier ramps up production for a viral product. Run any supplier through the Supplier Risk checklist before sourcing this category — the Risk tab flags this.
Our take for a new entrant in May 2026: hold, with tight margin discipline. If you can source from a supplier with a clean dispute record and a different creative angle (we have not seen one work recently), it could still test profitably. Most operators entering today will not.
5. Product 4 — LED strip lights with motion sensor
The pitch in April lists: home décor category, smart-home tie-in, repeat-purchase potential. Several lists ranked it as a Strong Buy.
Today's read: crowded. This product was already crowded in the basic-LED-strip variant. The motion-sensor variant added a thin differentiation window that has since closed. The supplier count for "LED strip motion sensor" has climbed steeply since the start of the year.
The economics today: retail prices have compressed as sellers undercut each other, while AliExpress unit cost has stayed flat — a direct squeeze on new-entrant margin. With CPM inflation on home-décor audiences also climbing in Q2, real net margin is thin for most testers.
Our take for a new entrant in May 2026: skip. Retail-price compression plus a crowded market is an unwinnable combination for solo operators. This belongs in a Q1 2026 winning-products list (where it lived) and not on any Q2 list.
6. Product 5 — Heating-version collagen facial roller
The pitch in April lists: beauty / skincare tools category, demonstrable visual demo, premium-feel positioning at sub-$30 retail.
Today's read: crowded, with a beauty-specific complication that competition alone does not capture — review authenticity. Many of the busiest supplier listings show review patterns consistent with inflation: a wall of five-star ratings, almost no critical reviews, and review spikes that track supplier promotions rather than organic buying. Open the star breakdown on the top listings and that shape is visible in about ten seconds; our fake-review guide walks through what to look for.
Why this matters for new entrants: customer-side, the product underdelivers against the premium positioning. Refund rate at scale is materially higher than the listing reviews suggest. Late-stage operators entering this niche today absorb the gap between marketing claim and product reality through chargebacks and refunds.
Our take for a new entrant in May 2026: skip. A crowded market and trust failures stack into a margin profile that does not work.
7. The pattern — and what to do instead
The five products above share a profile: each was a real winner six to twelve weeks ago, ranked on accurate Q1 2026 readings, then became crowded faster than the lists could update. By the time the list reaches the operator's reading list, the entry window has closed for everyone except large stores running creative at scale.
The behavioural fix is simple. Treat winning-product lists as shortlist generators, not buy decisions. Then verify each candidate against four live signals before allocating test budget:
- Competition read still low — verify on the day you commit budget, not when the list was written. Once a market is crowded, the math gets steep for solo testers.
- Momentum still building, not fading — a category past its peak loses money for late entrants regardless of how strong it once looked.
- Supplier risk clean — high-volume products attract suppliers who scale quality down. The Risk tab catches elevated dispute rates and slow response times.
- Review distribution shows real spread — the Reviews tab breaks the ratings out star by star, so you can see at a glance whether there is a normal tail of 2s and 3s. A wall of five stars with no critical ones is a review-farm signal, and it is you, not the extension, making that call.
All four signals are visible on every AliExpress product page when you have AliShopping Tools installed.
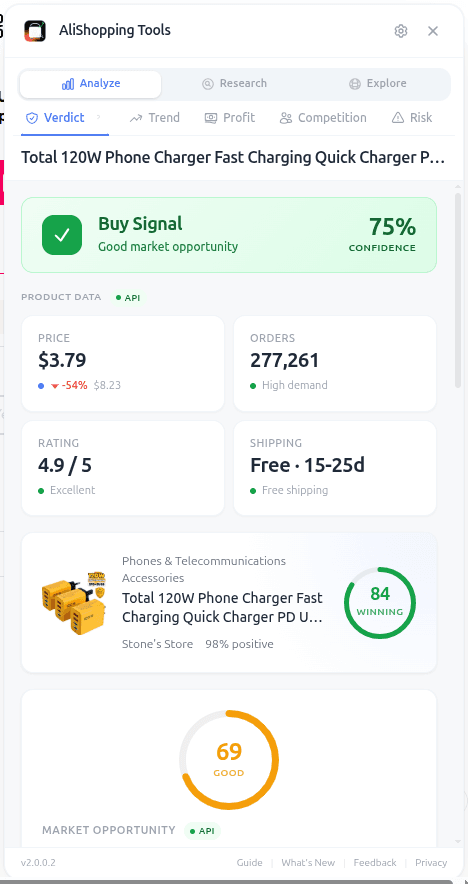
Install AliShopping Tools — verify any winning-product candidate in 30 seconds — live competition read, momentum, supplier risk, and the listing's own review evidence on every AliExpress page. No account, no credit card. The screenshots in this post are the live panel — same view you get when you open any AliExpress listing in Chrome.
For the products that are worth testing in May 2026, our Top Trending Dropshipping Products for April 2026 list groups candidates by momentum. The still-building candidates are the ones a solo tester can run through before the market crowds. We refresh the list as competition moves; the winning-products April 2026 list is the companion editorial view.
For the broader framework on why most product research goes wrong before any ad spend, our research-mistakes guide covers the seven recurring patterns, and the dropshipping product research guide is the pillar that ties competition, momentum, supplier risk, and reading the review evidence into one repeatable workflow. The five products in this article are five different surfaces of the same underlying mistake: trusting a static snapshot. Treat every winning-products list as the start of verification, not the end — competition moves weekly, and winning products losing money is the predictable end state of a list-driven entry on a fast-moving market.
8. Run your own competition check in 30 seconds
The argument of this post is simple: do not buy a list, verify a list. The verification takes less time than reading the list itself.
Install AliShopping Tools free from the Chrome Web Store — open any AliExpress product page, the Competition tab shows how crowded it is, the Trend tab shows whether momentum is building or fading, the Risk tab catches supplier dispute and response-time issues, and the Reviews tab puts the star-by-star spread and the buyer photos in front of you so you can judge the feedback yourself. No account, no credit card. The five products above all read green on three-month-old data and red on today's data; the difference is what the live competition read looks like, and it is the difference between profit and tuition.
If you have already started a test cycle on one of the five products above, the Competition tab guide walks through how to read crowding directly — kill criteria worth applying before sinking more budget.
Disclosure: This article is published by the AliShopping Tools team. The competition, supplier-risk, and review readings described above reflect the AliShopping Tools Competition, Trend, Risk and Reviews panels as read in late April 2026; the review judgements are our own reading of the listings' star spreads, not an output of the extension. Crowding is volatile — readings change weekly, and the live panel is always the source of truth. Email feedback via contact page.
All trademarks referenced are the property of their respective owners. This guide is for educational purposes and is not financial advice.
Before you buy
Saw a product on TikTok? Check if the AliExpress deal is real.
Prices often get marked up right before a “sale.” AliShopping Tools shows the 90-day price history, the seller’s real trust score, and working promo codes on the AliExpress page itself — so you can tell a genuine discount from an inflated one before you spend. No account, no signup.
Ready to find winning products?
Try AliShopping Tools — 15 free AI tools for product research.
Quick answers
Frequently Asked Questions
1Why are popular winning product lists often outdated by the time they publish?
Lists publish, operators pile in within days, competition spikes, and late entrants pay inflated CPMs against thin margins.
A product with light competition when a list is written can become crowded within weeks.
The static as-of-publish read is misleading for anyone implementing weeks after publication.
2What saturation level makes a winning product unprofitable for new entrants?
Once a product is heavily saturated, most new entrants find paid ad economics unworkable — too many competitors driving up CPMs against margins that have compressed from price competition.
Moderately competitive products require strong differentiation to remain profitable.
The viable entry zone is where competition is still light for the level of demand on offer.
3How do I check product saturation before copying a winning products list?
Read the AliShopping Tools Competition tab on the AliExpress listing to gauge how crowded the product is.
Check how many Shopify stores are selling the identical product via Shopify spy.
Check the Trend tab for demand direction — if demand has already turned down since the list published, the entry window has likely passed.
Run these checks before copying any product recommendation, regardless of source.
4What is the right way to use winning product lists?
Use them as inspiration for category research, not as direct product selections.
When you see a product on a list, verify how crowded the market currently is, the current demand direction, and competitor density before testing.
A product that was a winner at list publication may need complete market re-evaluation 4 to 8 weeks later.
5How does rising competition change the ad math on a 'winning' product?
As more sellers pile into the same product, cost per thousand impressions (CPM) climbs while price competition compresses your margin — so the same product that was profitable at launch can stop covering its ad cost.
The practical implication: don't reuse an old list's economics.
Before spending, check current competition on the Competition tab and confirm the margin on the live listing, because both the CPM you'll pay and the margin you'll keep move against you as a product gets crowded.
6What early warning signs in AliExpress data indicate a winning product is about to get crowded?
A sharp rise in the number of active sellers listing the same item on AliExpress is the most reliable early warning that a product is about to get crowded.
When seller counts jump week over week, competition and ad costs usually follow.
Track how many sellers are offering the item in the AliShopping Tools Competition tab, and pause or scale back ad spend once the field starts filling quickly, so you avoid entering a high-CPM, low-margin stage.
7Can I still run a profitable TikTok campaign on a product that is already crowded, and how should I adjust the budget?
Sometimes — but only if you can keep your acquisition cost below what each sale actually earns, which gets harder as competition rises.
On a crowded product, shifting budget toward retargeting audiences that have already engaged with your brand usually costs less than cold traffic and helps protect a margin that price competition is squeezing.
Confirm the product still leaves room on the live listing before committing spend, rather than assuming the economics from when the list was published still hold.
8How does rising competition affect private-label products versus pure dropshipping items?
Private-label products are generally more resilient to a competition surge because a brand premium is harder for copycats to undercut, whereas pure dropshipping items lose margin quickly once many sellers list the identical product.
The practical takeaway is to differentiate — unique packaging, a branded story, or a bundled accessory — so your listing does not compete purely on price.
That differentiation is what preserves margin as a category gets crowded.
9What process should I follow to validate a 'winning' product before investing ad spend?
Rather than trusting a static list, validate against current conditions:
- 1open the product on AliExpress and read the Competition tab in AliShopping Tools to see how crowded it already is;
- 2check whether the number of sellers has been climbing recently, which signals a closing window;
- 3confirm the margin on the live listing after landed cost, shipping, and fees;
- 4run a small test budget before committing to volume; and
- 5scale only if the test returns a healthy return on ad spend, otherwise pause. This uses live signals instead of a snapshot and helps you avoid the profit trap that caught the products in the article.
More from the blog
Winning Products Q2 2026: 15 Dropshipping Picks
15 product categories for Q2 2026 — April-June dropshipping picks mapped to the month each peaks, plus how to vet any candidate in AStools. Updated free.
Winning Products August 2026: 12 Back-to-School Peak Categories
12 dropshipping categories for August 2026 — back-to-school peak (first two weeks), dorm setup, and the early-fall transition — plus how to vet any candidate with AStools before you spend.
Winning Products July 2026: 12 Post-618 Categories
12 dropshipping categories for July 2026 — post-618 restock, back-to-school prep, summer peak — plus how to vet any candidate with AStools before you spend.