Trend & TikTok Viral Analysis
See trend classification (Rising, Peaking, Stable, Declining), Momentum Score, and TikTok Viral potential for any AliExpress product. Free, updated daily.
Timing is everything in dropshipping. The same product can be a goldmine in February and a graveyard by April. The Trend tab tells you exactly where a product sits in its lifecycle and whether the momentum is still building or already fading.
The headline metric is the Trend Classification: Rising, Peaking, Stable, or Declining. This is computed from order velocity, search interest, and review acceleration over the last 90 days. Products in the Rising stage are the holy grail — demand is climbing but the market hasn't saturated yet.
Why It Matters
Riding a Rising product means cheaper ad costs (less competition for ad inventory), better organic reach (the algorithm rewards novelty), and longer profit windows. Jumping into a Peaking product means you'll spend more on ads to grab the last wave of buyers before the trend dies. Declining products almost always lose money because ad costs catch up to falling demand.
What You'll See
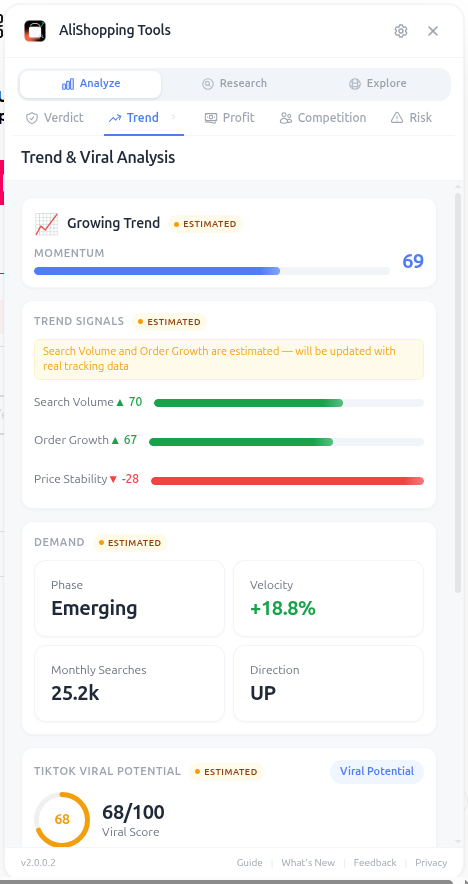
- Trend Classification — Rising, Peaking, Stable, or Declining badge
- Momentum Score (0-100) — rate of change in demand over the last 30 days
- TikTok Viral Score — AI-estimated short-form video potential (visual appeal, novelty, unboxing factor, demo-ability)
- Ad Angles — suggested marketing hooks, pain points, and target demographics
- Trend Chart — 90-day visualization of order volume + search interest
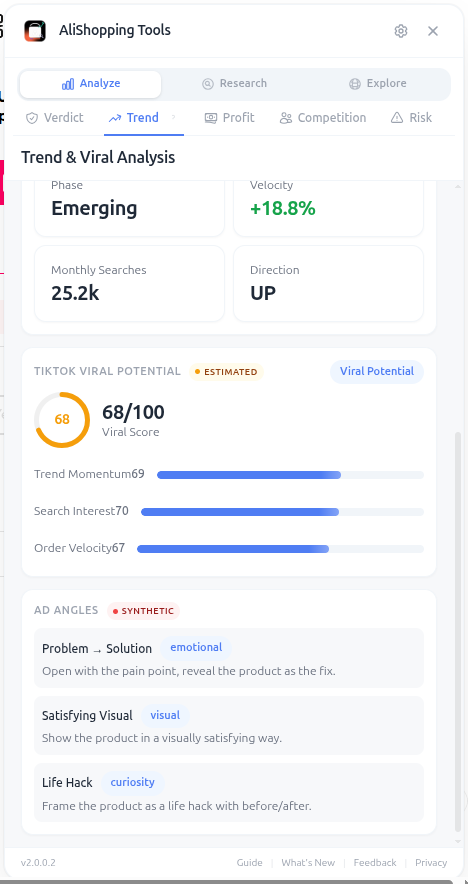
The TikTok Viral Score is particularly valuable because TikTok is now the #1 traffic source for impulse-buy dropshipping products. A product with a Viral Score above 75 has the visual and demonstration characteristics that perform well in 15-30 second videos.
How to Use It
- Open the AliExpress product page.
- Click the Trend tab in the side panel.
- Read the Classification badge — only Rising and Stable products are usually worth ad spend.
- Check Momentum Score: 60+ means accelerating, 40-60 means flat, under 40 means slowing.
- Look at the trend chart shape. A clean upward curve is bullish. A sharp peak followed by decline is bearish.
- Read the TikTok Viral Score. If it's 70+, plan your creatives around short-form video.
- Use the Ad Angles list as starting hooks for your first three creative tests.
- Cross-reference with the Profit tab — viral + thin margin = lose money on ads.
Real Example
When a product shows a Rising classification with high Momentum and TikTok Viral scores, and the trend chart shows order volume climbing over recent weeks, that combination of signals suggests launching creatives quickly. A Rising product typically means lower ad costs (less competition for ad inventory) and better organic reach. The Trend tab surfaces these signals so you can time your entry before the wave peaks.
Pro Tips
- Rising + low TikTok Viral usually means the product works on Facebook but won't crush on TikTok — adjust your ad strategy accordingly.
- Stable products with strong margins are great evergreen offers — less exciting than viral wins but predictable revenue.
- A Peaking badge isn't a death sentence if you have a unique angle competitors haven't used yet.
Common Mistakes
- Chasing Declining products because they have the most reviews and "social proof" — those reviews are old, the demand has moved on.
- Ignoring the TikTok score when your traffic strategy is paid TikTok ads — you'll burn cash on products that don't film well.
- Treating Momentum as Winning Score — high momentum on a low-margin product still loses money.
Related Guides
FAQ
Frequently Asked Questions
1What does the Trend tab's classification actually measure?
The Trend Classification (Rising, Peaking, Stable, or Declining) is computed from order velocity, search interest, and review acceleration over the last 90 days per the guide.
Rising is the holy grail — demand is climbing but the market has not saturated yet.
Peaking means you are about to grab the last wave before the trend dies.
Declining products almost always lose money because ad costs catch up to falling demand.
Only Rising and Stable products are usually worth ad spend.
2How do I read the Momentum Score?
60+ means demand is accelerating, 40–60 means flat, under 40 means slowing.
Combine with the trend chart shape — a clean upward curve is bullish, a sharp peak followed by decline is bearish.
When you see Rising classification with high Momentum and TikTok Viral scores together, that combination of signals typically justifies launching creatives quickly.
3What does the TikTok Viral Score evaluate?
The TikTok Viral Score is an AI estimate of short-form video potential based on visual appeal, novelty, unboxing factor, and demo-ability.
The guide says a score above 75 means the product has the visual and demonstration characteristics that perform well in 15–30 second videos.
Above 70 — plan your creatives around short-form video.
The Ad Angles list in the same tab gives you 3–5 starter hooks (pain points, target demographics) so you can film first-version creatives without a marketing team.
Related Guides
AI Verdict
Get a Strong Buy, Buy Signal, Hold / Watch, or Pass AI recommendation in seconds for any AliExpress product. Includes Winning Score, Market Opportunity radar, and price history.
Profit Simulator
Calculate full unit economics for any AliExpress product — product cost, shipping, processing fees, ad spend, net margin, and monthly revenue projections.
Competition
Assess market saturation, seller distribution, and monthly search volume for any AliExpress product. Know if a niche is open or crowded before spending on ads.
Risk Assessment
Identify risk flags, seller trust issues, and business license status before committing to a supplier. Avoid chargebacks, IP bans, and unreliable shipping.