Competition Analysis
Assess market saturation, seller distribution, and monthly search volume for any AliExpress product. Know if a niche is open or crowded before spending on ads.
Picking a great product in a saturated market is one of the most expensive mistakes a dropshipper can make. The Competition tab measures how crowded the field is for any given product, who already dominates it, and whether there's still room to enter profitably. It's the difference between launching into open water and swimming with sharks.
The headline metric is the Saturation Score (0-100). Lower is better: a score of 25 means there are very few sellers competing for the keyword, while 85 means you're entering a knife fight. The tab also shows you HOW the existing sales are distributed — concentrated in 2-3 dominant sellers (hard to break in) or fragmented across hundreds of small sellers (easier to enter).
Why It Matters
Saturation directly drives your ad costs. In crowded markets, every Facebook and TikTok advertiser is bidding for the same eyeballs, which inflates CPM and CPC. Worse, the dominant sellers usually have 5-star reviews and proven creatives that crush new entrants on click-through rate. Knowing the saturation level before you spend a dollar lets you avoid markets where you're structurally disadvantaged.
What You'll See
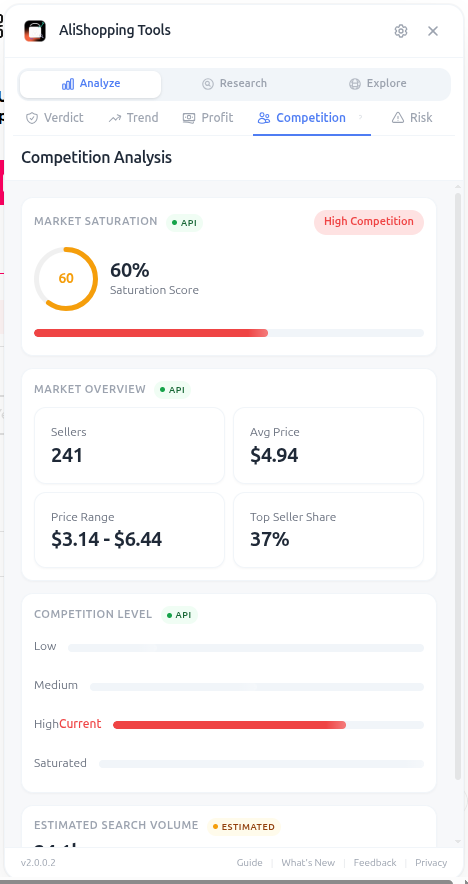
- Saturation Score (0-100) — how crowded the market is; lower is better
- Market Overview — total sellers, average price range, monthly sales volume across all listings
- Seller Distribution — concentrated vs. fragmented breakdown
- Search Volume — estimated monthly searches on AliExpress and Google
- Entry Difficulty — go/no-go badge based on the combination of all signals
The Search Volume number is critical. A market can be unsaturated AND have low search volume, which just means no one wants the product. The sweet spot is high search + low saturation, which signals real demand the existing sellers haven't fully captured.
How to Use It
- Open the AliExpress product page.
- Click the Competition tab.
- Read the Saturation Score: under 40 = green light, 40-65 = yellow, over 65 = red.
- Look at the Seller Distribution chart. Fragmented markets are friendlier for new sellers.
- Compare Search Volume against the seller count to find demand-supply gaps.
- Read the Entry Difficulty badge as your final go/no-go.
- If the market is concentrated, study the top 3 sellers' pricing and shipping to find your differentiation angle.
- Cross-check with the Trend tab — high competition + Rising trend can still work because the market is growing.
Real Example
When the Competition tab shows high Saturation (above 65) with the top sellers controlling a large share of total sales, the Entry Difficulty will read "Hard." This signals a market dominated by established sellers with thousands of reviews. Breaking in would require either a much lower price (killing margin) or a unique angle. In these cases, skip the product and search for less saturated alternatives in the same niche — look for Saturation under 40 paired with decent search volume.
Pro Tips
- Fragmented markets with 50+ small sellers and no clear leader are the easiest to enter — pick a product, position it well, and you can be the new top seller in 60 days.
- Concentrated markets aren't always bad if you can undercut the dominant seller on a specific axis (faster shipping, better photos, cheaper price).
- Use Search Volume divided by Seller Count as a quick "demand per seller" heuristic — anything above 100 is a good sign.
Common Mistakes
- Equating "high competition" with "bad product" — high competition often means high demand, which is what you want.
- Ignoring seller distribution and only looking at the saturation score.
- Entering concentrated markets without a clear differentiation strategy.
Related Guides
FAQ
Frequently Asked Questions
1How do I read the Saturation Score?
Under 40 is a green light with very few sellers competing, 40–65 is yellow — proceed with care, over 65 is a red light and usually means tough competition with thousands of established reviews against you.
The sweet spot is high search volume paired with saturation below 40 — that signals real demand that existing sellers haven't fully captured.
2Why is seller distribution as important as saturation?
Because two markets at the same saturation score behave very differently depending on distribution.
Concentrated markets with 2–3 dominant sellers are hard to break into — they have thousands of reviews and proven creatives.
Fragmented markets with 50+ small sellers and no clear leader are the easiest to enter; pick a product, position it well, and you can become the new top seller in 60 days.
Always read the distribution chart, not just the headline score.
3What is the "demand per seller" heuristic the guide recommends?
Search Volume divided by Seller Count — anything above 100 is a good sign per the guide.
It tells you whether demand has outpaced supply.
A market with 28,000 monthly searches and 340 sellers is 82 per seller (marginal); the same 28K searches with 45 sellers is 622 per seller (healthy).
Combine this heuristic with the Entry Difficulty badge (go/no-go), the Trend classification, and the seller-distribution chart to decide whether to enter.
Related Guides
AI Verdict
Get a Strong Buy, Buy Signal, Hold / Watch, or Pass AI recommendation in seconds for any AliExpress product. Includes Winning Score, Market Opportunity radar, and price history.
Trend Analysis
See trend classification (Rising, Peaking, Stable, Declining), Momentum Score, and TikTok Viral potential for any AliExpress product. Free, updated daily.
Profit Simulator
Calculate full unit economics for any AliExpress product — product cost, shipping, processing fees, ad spend, net margin, and monthly revenue projections.
Risk Assessment
Identify risk flags, seller trust issues, and business license status before committing to a supplier. Avoid chargebacks, IP bans, and unreliable shipping.