AliExpress Price History Chart 2026: Free Chrome Tracker (No Signup, 90-Day Data)
AliExpress Price History: Why It Matters and How to Check It (2026)
Quick Answer: AliExpress does not display price history natively. The fastest way to see 90-day price data on any listing is the free AliShopping Tools Chrome extension — it overlays a rolling price chart directly on the product page, no signup required. Use price history to spot fake discount anchors, time bulk orders to genuine low windows, and detect when a supplier switches to cheaper materials.
The price on an AliExpress listing right now tells you almost nothing. It is a single snapshot that lacks every piece of context you need to make a smart buying decision. Was this product cheaper last month? Has the price been climbing steadily for six months? Is that "78% off" banner real, or did the seller inflate the original price yesterday to make a normal price look like a steal?
These are not hypothetical questions. They are the difference between running profitable margins and watching your profit disappear because you bought at a peak. For dropshippers, affiliates, and anyone sourcing products from AliExpress, price history is one of the most underused pieces of intelligence available, and ignoring it costs real money. To settle the "is that 78% off real?" question on a specific listing right now, paste it into the free is this AliExpress sale real? checker — it reads our recorded 90-day history and returns a genuine, not-the-lowest, or inflated verdict.
What price history reveals
| Price pattern | What it suggests | Sourcing action |
|---|---|---|
| Stable price for 60 plus days | Real cost baseline, supplier is established | Source with confidence |
| Recent 20-35 percent drop from stable baseline | Genuine promotional window | Time bulk orders to the window |
| Spike then drop to "discounted" price | Fake-anchor discount game | Do not trust the percentage off |
| Rising trend over 90 days | Raw materials or supply pressure | Hedge with backup supplier |
| Sudden spike with stock drop | Supplier running out, may discontinue | Move to similar-product supplier |
Why Price History Matters for Dropshippers
If you source products from AliExpress and sell them through your own store, your product cost is the foundation of your entire business model. Every cent matters. A product that costs $4.20 today might have been $3.50 three weeks ago and could drop back to $3.80 next week. That $0.40-$0.70 difference might not sound dramatic, but multiply it across hundreds of orders and it directly impacts your margins.
Price history gives you three things that the current price alone cannot.
1. A Baseline for What the Product Actually Costs
Most AliExpress products have a "normal" price range. They fluctuate within a band that reflects the actual cost of manufacturing, shipping, and the seller's margin. When you can see six months of pricing data, you know what that band looks like. You know whether $4.20 is the high end, the low end, or somewhere in the middle.
Without that context, you are guessing. And guessing your cost basis is a fast way to kill your margins.
2. Timing for Bulk Orders
AliExpress prices are not static. They move based on supplier demand, raw material costs, seasonal patterns, and platform-wide promotions like the 11.11 sale, Summer Sale, or Anniversary Sale. If you can see that a product consistently drops 15-25% during major sales events, you can plan your inventory purchases around those windows and lock in lower costs for weeks of orders.
Dropshippers who buy at full price year-round leave money on the table that their competitors are picking up.
3. Early Warning for Supplier Changes
A sudden price increase on a product you have been selling for months is a signal. The supplier's costs may have gone up, the product may be going out of stock, or the seller may be preparing to discontinue the item. A gradual upward trend over several months often means raw material costs are rising across the category.
Either way, price history gives you advance notice. You can find alternative suppliers, adjust your retail pricing, or start transitioning to a replacement product before you get caught off guard.
What Price Patterns Reveal
Once you start looking at price history charts, certain patterns repeat across thousands of AliExpress listings. Learning to read them gives you an information edge that most sellers never develop.
Inflated Discounts
This is the most common pricing pattern on AliExpress. A seller sets a product's "original price" to $25, then lists a "sale price" of $8.99 with a big red "64% OFF" banner. It looks like an incredible deal.
But check the price history and you will often find that the product has never actually sold for $25. The real price has been between $7 and $10 for the entire life of the listing. The "original price" is fiction, manufactured to create urgency that does not exist.
For dropshippers, this means you might overpay thinking you are getting a deal. And if you pass along those inflated discount percentages in your own marketing, you may be basing your marketing on inaccurate reference pricing.
Seasonal Pricing Cycles
Many product categories follow predictable seasonal patterns. Phone accessories tend to spike after major phone launches. Outdoor and garden products rise in spring and drop in autumn. Holiday-themed items follow obvious cycles but start their price increases earlier than you might expect, often 6-8 weeks before the holiday.
Price history lets you map these cycles for your specific products so you can buy during the low periods and maintain healthy margins even when your competitors are eating increased costs.
Unexpected Product Changes
Here is a pattern that catches a lot of dropshippers. A product listing maintains a steady price for months, then suddenly drops 30-40% overnight. That is not a sale. In many cases, the seller has switched to a cheaper manufacturer or inferior materials. The listing looks the same. The photos are the same. But the product that arrives is different from the one that earned all those five-star reviews.
Price history makes this visible. A sharp, sustained price drop with no corresponding platform-wide sale event is a red flag that something fundamental changed about the product.
Gradual Inflation
Some sellers raise prices by tiny increments, 5-10 cents at a time, every few weeks. Each individual increase is too small to notice, but over three to six months, the product might be 20-30% more expensive than when you started selling it. If you set your retail price based on the original cost and never revisit it, your margins erode silently.
A price history chart makes gradual inflation immediately obvious, even when each individual change was invisible.
How to Check AliExpress Price History
There are several approaches to tracking price history on AliExpress, ranging from manual to fully automated.
Manual Method: Screenshots and Spreadsheets
The most basic approach is recording prices in a spreadsheet at regular intervals. Open the listing, note the date and price, repeat weekly. In practice, almost nobody maintains this. It is tedious, it only captures data from the point you start tracking, and by the time you have enough data points to spot a pattern, you may have already made buying decisions based on incomplete information.
Browser Extension Method
Dedicated browser extensions can pull price history data automatically and display it directly on the AliExpress product page while you browse. No spreadsheets, no manual tracking, and the historical data often extends back months before you ever looked at the product.
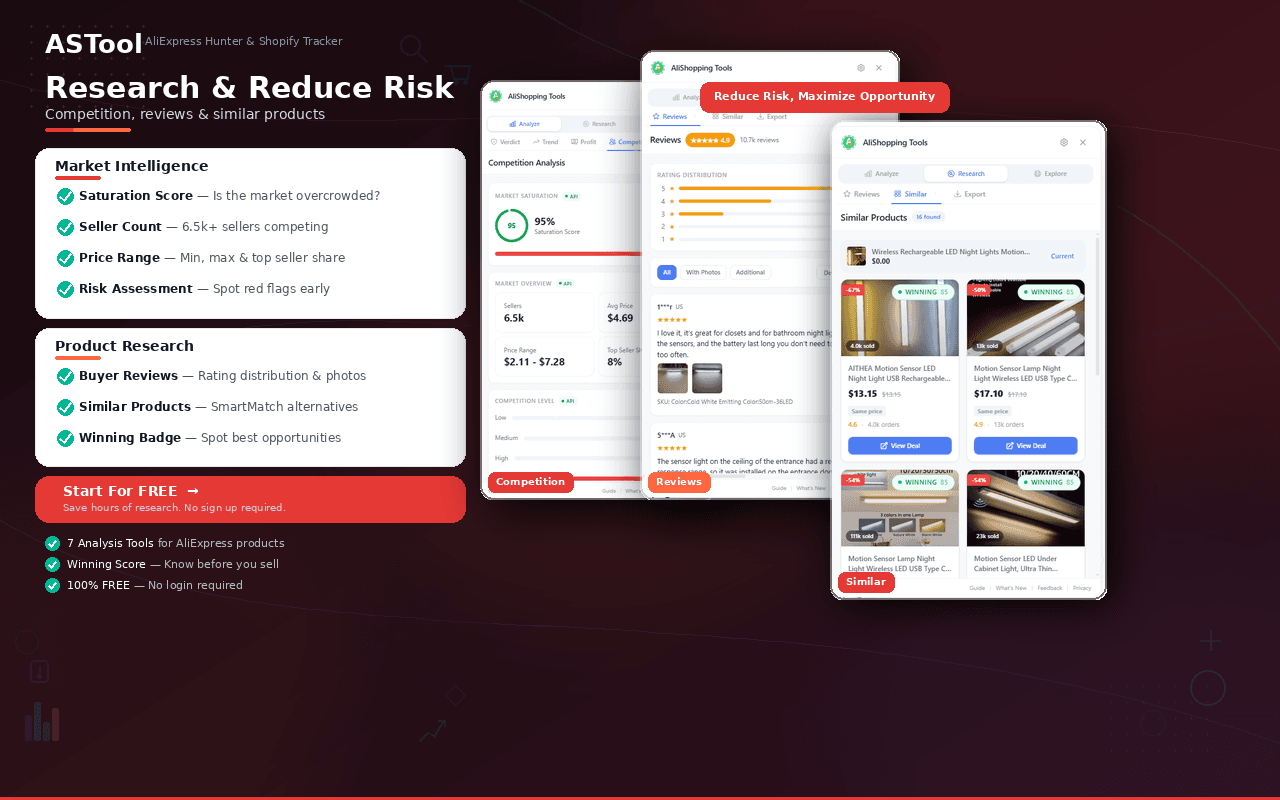
AliShopping Tools includes a price tracking feature that shows price trends right alongside the product analysis. When you are evaluating a product on AliExpress, the price data appears in context with other signals like demand trends, profit simulation, and supplier risk, so you are not looking at price in isolation. You are seeing it as part of a complete picture.
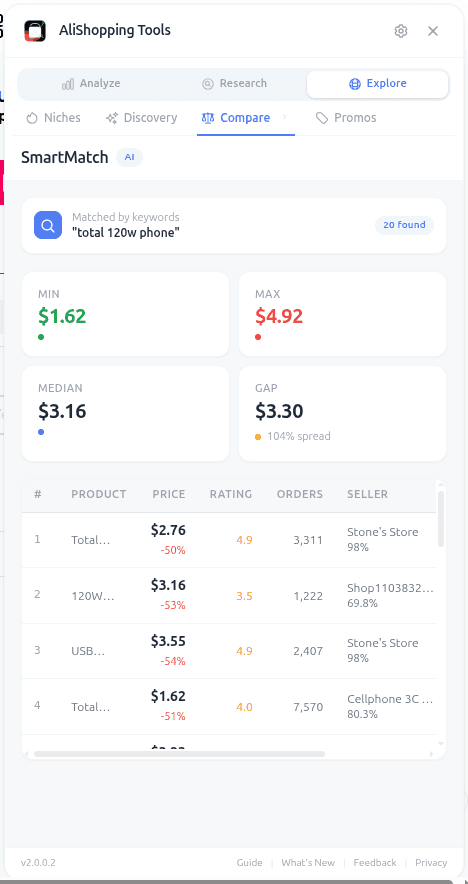
The Compare tab is particularly useful here. It pulls similar products from multiple sellers and shows you price comparisons with auto-tagged insights like "cheapest," "best value," and "top rated." When you combine current price comparisons across sellers with historical price data for each listing, you get a comprehensive view of whether you are looking at a genuinely good deal or a manufactured one.
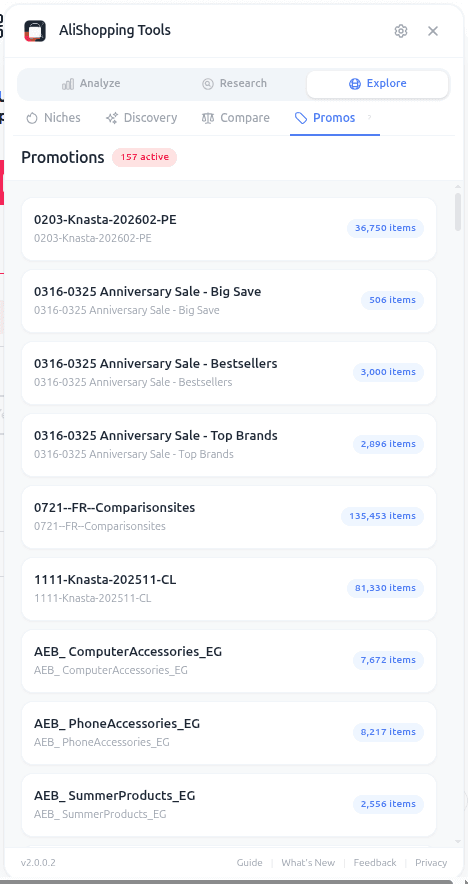
Platform Promotion Calendars
AliExpress runs major sales on a predictable schedule: Anniversary Sale (March), Summer Sale (June), 11.11 (November), and 12.12 (December). Knowing when these events happen helps you anticipate price drops, but it does not tell you how much a specific product will drop. Price history fills that gap. You can see how much a product actually dropped during previous events, which is far more actionable than hoping your product will be included in the next sale.
How to Use Price Data for Buying Decisions
Having price history data is only useful if you apply it to your actual decision-making. Here is a practical framework.
Set Your Maximum Cost
Look at the price history and identify the product's normal range. The upper end of that range is your maximum acceptable cost. If the current price is above that ceiling, wait. If it is within the range, proceed with your margin calculations using the current price as a realistic cost basis rather than hoping it will drop.
Calculate Margins at Three Price Points
Use the historical low, the current price, and the historical high to calculate three margin scenarios for your store. If your margins are healthy even at the historical high, you have a resilient product. If your margins only work at the historical low, you have a fragile business that one price fluctuation can break.
Time Your Restocking
If you see a consistent pattern of price drops during major sales events, plan your inventory purchases around those windows. Place larger orders during the dips and smaller orders during normal pricing periods. Over a year, this timing difference alone can improve your average cost by 10-20%.
Monitor for Anomalies
Once you have established a price baseline for your active products, any movement outside the normal range is worth investigating. A sudden drop might mean a quality change. A sudden spike might mean supply issues. A gradual upward trend might mean it is time to find an alternative supplier or adjust your retail pricing.
Common Pricing Patterns to Monitor
Beyond the patterns above, sellers use a few specific pricing strategies that price history data exposes immediately.
Pre-sale inflation. Before a major sale event, some sellers raise prices by 20-40%. When the "discount" kicks in, the price lands right back where it was before. Price history makes this transparent: a spike in the weeks before a sale followed by a "discount" to the previous level is a manufactured promotion.
Anchor price inflation. The strikethrough "original price" on AliExpress listings is set by the seller with no requirement that the product was ever sold at that price. A $35 strikethrough on a $9 product looks like 74% off, but if the price history shows it has always been $8-10, the "original" was never real.
Variant price hiding. A listing advertises "from $2.99," but only an undesirable variant (XS size, single piece) sits at that price. The variants buyers actually want cost $6-8. The $2.99 exists to game search results.
Loss leader strategy. A seller prices one product below cost to build reviews and reputation, then gradually raises prices across the store. Dropshippers who committed based on the initial low price find their costs creeping up with no easy way to switch.
Frequently Asked Questions
How far back does AliExpress price history data go?
It depends on the tool and the listing age. Browser extensions like AliShopping Tools can show price trends spanning several months of historical data. The listing must have been active during that period for data to exist. Newer listings with only a few weeks of history will naturally show less price movement.
Are AliExpress sale discounts (like 11.11) actually real?
Some are genuine, but many are inflated. Sellers commonly raise prices 2-4 weeks before major sales, then apply a "discount" that brings the price back to its normal level. Price history data exposes this tactic instantly. Check whether the pre-sale price was consistent for months or if it spiked just before the promotion.
How often do AliExpress product prices change?
Most products see price adjustments every few weeks, with larger movements around major sale events (March Anniversary Sale, June Summer Sale, 11.11, 12.12). Gradual inflation of 5-10 cents at a time is common and hard to notice without tracking tools. Some products remain stable for months, while competitive categories see weekly price shifts.
Should I wait for a sale to place bulk orders from AliExpress?
If price history shows your product consistently drops 15-25% during major sales, yes. Place larger orders during sale windows to lock in lower per-unit costs. But do not delay validated product launches just to save a few percent. Getting to market early often matters more than saving $0.50 per unit.
Making Price Intelligence a Habit
Checking price history should be part of your standard product evaluation workflow, right alongside demand analysis, profit simulation, and supplier vetting. The dropshippers who maintain healthy margins treat product costs as a variable to be managed, not a number to accept. If you are making sourcing decisions without price history, you are working with incomplete data, and in a margins-thin business, that is expensive.
Ready to stop guessing and start seeing the full pricing picture? Install AliShopping Tools for free. No account needed. Price history, seller comparison, profit simulation, and AI-powered product analysis, all in one extension that works right on AliExpress while you browse.
Related: AliExpress Price Chart Tracker 2026: 90-Day Rolling Chart on Every Listing — a deeper look at the five price patterns (stable, real discount, fake anchor, rising trend, spike-and-crash) and how to apply each to buying decisions.
AliShopping Tools
See live AliExpress data in your browser.
Seller trust score, 90-day price history, and live promo codes — on every AliExpress product page. No account, free.
Ready to find winning products?
Try AliShopping Tools — 15 free AI tools for product research.
Quick answers
Frequently Asked Questions
1Why does AliExpress price history matter for dropshippers?
The post lays out three reasons: price history gives you a baseline for a product's normal cost band so you know if today's $4.20 is actually high or low, it lets you time bulk orders around 11.11/Summer/Anniversary sales when prices drop 15–25%, and it provides early warning of supplier changes — a sudden price increase often signals rising raw-material costs or an item going out of stock.
Without history you are guessing at your cost basis, which silently erodes margins.
2What pricing patterns should I watch for on AliExpress?
The post names four: inflated discounts (a "64% off" banner where the "original" $25 price never actually existed and the product has always sold around $7–$10), seasonal cycles that start 6–8 weeks before a holiday, unexpected sustained 30–40% drops that often indicate the seller switched to a cheaper manufacturer or inferior materials, and gradual inflation — 5–10 cent increases every few weeks that total 20–30% over three to six months without anyone noticing.
3How do I track AliExpress price history in practice?
Manual screenshots and spreadsheets work in theory but almost nobody keeps them up because it is tedious and only captures data from the day you start.
The post recommends automated tracking via a tool like AliShopping Tools, which surfaces the price-history chart and current promotions directly on the AliExpress product page so you can verify discount claims, spot gradual inflation, and time your orders without opening extra tabs.
More from the blog
How to Do Product Research for Dropshipping: 7-Step Framework (Free Tools, 2026)
A repeatable 7-step product research framework for dropshippers in 2026 — from idea sourcing to live testing, using only free tools. No Ecomhunt subscription needed.
AliExpress Find Similar Products — 5 Methods That Actually Work in 2026
Found a great product on AliExpress but want alternatives, a cheaper version, or a better supplier? This guide covers every method to find similar AliExpress products — built-in tools, image search, keyword strategies, and the AStools extension.
What Is a Winning Score for Dropshipping Products? (Complete Guide)
The Winning Score (0–100) rates every AliExpress product from seven weighted signals on its listing. Learn what each factor measures, what the score does not measure, and how to read the three bands.