
AliExpress Price Chart 2026: Track Price History on Any Product (Free Chrome Extension)
AliExpress Price Chart 2026: Track Price History on Any Product
Quick answer: AliExpress does not show price history natively — sellers exploit this to manufacture fake 70–80% discount banners by inflating "original prices." The free AliShopping Tools Chrome extension overlays a 90-day rolling price chart on every product page (no account, no signup), so you can instantly see whether a discount is real or a manipulated anchor price.
AliExpress shows one number on every listing — today's price. There is no price chart. There is no history tab. There is no way, inside the native interface, to see what the product cost yesterday, last week, or before the seller slapped a "78% OFF" banner on it. That is not an accident. The current price, isolated from history, is the most profitable view AliExpress can show its sellers. This guide covers how to add a real 90-day rolling chart to every product page, why the chart matters more in 2026 than ever, and the five price patterns that separate honest listings from manipulated ones.
Why AliExpress Price History Matters in 2026
Walk through any AliExpress search results page right now. You will see "70% off," "82% off," "Lowest price ever" banners on roughly half the listings. Almost none of those discounts are real.
Here is how the trick works. A seller has a product that genuinely costs $2.40 to deliver and they have sold it at $3.99 for the last six months. They want to run a "promotion." They edit the listing's strikethrough "original price" from a non-existent $4.50 up to $19.99. They keep the actual selling price at $3.99. The banner now reads "80% OFF — was $19.99, now $3.99." Nothing changed except the fake anchor.
This pattern — anchor price manipulation — is endemic on AliExpress in 2026. The platform does not enforce that strikethrough prices ever existed as real selling prices. Sellers manufacture urgency by inflating reference prices, and shoppers respond to the size of the discount, not the absolute cost.
The consequences differ by audience:
- For buyers: You pay full price thinking you got a deal. Worse, you trust a seller who is willing to lie about pricing — which correlates with sellers willing to lie about product quality, shipping speed, and dispute outcomes.
- For dropshippers: Your entire margin model relies on knowing the real sourcing cost band. If you buy at a manufactured "discount" peak and your competitor sources from the same supplier during the actual low window, they undercut you by 15-25% and you cannot understand why.
- For affiliate marketers: You promote a "78% off" deal to your audience. When the chart shows the product has sat at the same price for 90 days, your audience figures out the discount is fake. Your conversion rate collapses and your trust score follows.
Solving this requires one thing: a price chart. Not a screenshot from last month, not a manual spreadsheet — a live, rolling chart that loads on every product page automatically.
How the AliShopping Tools Price Chart Works
AliShopping Tools is a free Chrome extension that injects a 90-day rolling chart directly into the AliExpress product page. The chart appears in the analysis panel beside the listing photos. No account, no signup, no payment.
What you see on the chart:
- X-axis: last 90 days, with optional 30-day and 60-day zoom views
- Y-axis: actual transacted listing price in USD (not the strikethrough "original" price)
- Plot line: daily price points connected as a smooth time-series
- Annotations: red flags on suspicious spikes, green flags on genuine drop windows
- Today marker: a vertical line marking the current price for instant comparison
What it means in practice:
- A flat line means the seller is honest about pricing — the product has cost the same for 90 days
- A jagged line means the seller is actively manipulating the listing price
- A spike followed by a "return to normal" days before a promotional banner appears means a fake-anchor discount
- A gradual upward slope across 60-90 days means supply pressure, raw material costs, or pre-holiday inflation
The chart auto-activates the moment you load any AliExpress product page. There is no button to click, no menu to open. You browse AliExpress normally and the data appears in context. The chart works on the standard desktop AliExpress experience; mobile coverage is on the roadmap but not yet shipped.
If you want the deeper theoretical framing of why price history matters, the AliExpress price history guide covers the underlying mechanics. This article is the practical, pattern-recognition companion.
5 Price Patterns to Recognize on the Chart
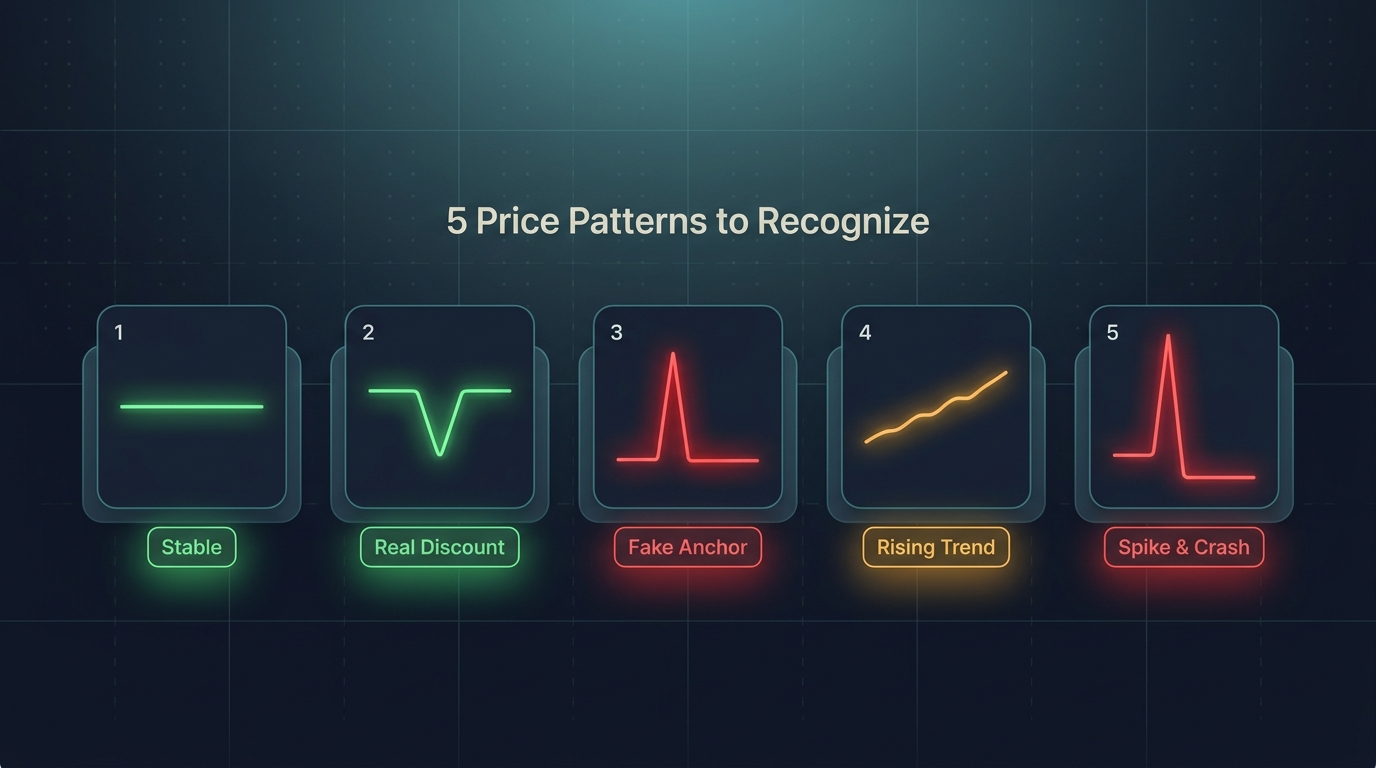
Once the chart is in front of you on every listing, the same five patterns repeat across thousands of products. Learning to spot them in 5 seconds is the single highest-leverage skill in AliExpress sourcing.
Pattern 1: Stable
A near-flat line across 60-90 days, with deviation under 5%. The seller has set a price that reflects real cost plus margin and they leave it alone. Stable listings are the highest-trust sourcing candidates. Dropshippers can build margin models with confidence. Buyers can purchase without waiting for a "discount" that will not improve the actual price.
Pattern 2: Real Discount Window
A flat baseline with one clear downward dip — usually 15-25% — that lasts 7-21 days and then returns to baseline. This is the genuine article: a real promotional window, almost always tied to a platform-wide event (Anniversary Sale in March, Summer Sale in June, 11.11, or 12.12). For dropshippers, time bulk orders to land inside this window. For buyers, set a calendar alert and wait if you can.
Pattern 3: Fake Anchor
The chart shows a flat price for 60+ days, then the strikethrough "original price" on the listing jumps up by 200-400% overnight while the actual price stays flat. The discount banner is pure theater. This is the most common AliExpress pricing pattern in 2026. When you see the banner promise "78% off" but the chart shows zero actual price movement, you are looking at a manufactured discount. Pass.
Pattern 4: Rising Trend
A steady upward slope across 30-60 days, each step small enough to ignore individually. By month 3, the product is 20-30% more expensive than when you started sourcing it. For dropshippers already selling this product, rising trend is the early-warning siren. Raw material costs may be climbing across the category, the supplier may be testing market tolerance, or a competing supplier may have exited and removed price pressure. Either way, lock in your alternative supplier before your margins erode further.
Pattern 5: Spike & Crash
Price holds steady, then spikes 40-80% in a single day, holds for 3-10 days, then crashes back below the original baseline. This pattern almost always means stock issues. The spike is the seller protecting remaining inventory while supply is tight; the crash is a clearance push to liquidate before discontinuing the listing. For dropshippers, treat this as a critical signal — the product is on its way out. Move your customers to a replacement supplier now, not after fulfillment fails.
How to Use the Price Chart in Your Workflow
The chart is only valuable if it changes your decisions. Here is how each audience should integrate it.
For Buyers: Timing a Purchase
Before adding anything to cart, glance at the chart for 5 seconds. If the line is flat (Pattern 1 or 3), the price will not improve — buy now or do not, but do not "wait for a sale" that will not lower the actual price. If you spot Pattern 2 starting to form (the first day or two of a real dip), buy immediately because the window closes fast. If you spot Pattern 4 (rising trend), buy now rather than next month.
For Dropshippers: Sourcing & Margin Protection
Run every candidate product through the chart before committing to a supplier. Reject Pattern 3 (Fake Anchor) suppliers on principle — sellers who manipulate price disclosures are the same sellers who manipulate shipping times and quality. Prioritize Pattern 1 (Stable) suppliers for steady products and Pattern 2 (Real Discount Window) timing for bulk restocks. Flag Pattern 4 and 5 products for weekly review so you spot the inflection before fulfillment breaks.
For full margin protection, pair the chart with the dropshipping profit margin calculator and calculate margins at three price points: historical low, current, and historical high. If your margin only works at the historical low, the product is fragile.
For Affiliate Marketers: Commission Timing
Promote products in Pattern 2 windows (real discount events) with confidence — your audience will verify the discount and trust your recommendation. Avoid promoting Pattern 3 fake-anchor "deals" entirely; the credibility hit is not worth the commission. Use Pattern 1 stable products as evergreen affiliate links since the price your readers see today is the price they will see in three weeks.
Can't You Just Use Camelizer or Wayback Machine?
If you already track Amazon prices, you know Camelizer (Camel Camel Camel). It is excellent — for Amazon. It does not work on AliExpress. Camelizer's database is built entirely from Amazon ASINs and Amazon's HTML structure. AliExpress product IDs are different, the page structure is different, and the price field is dynamically loaded in a way Camelizer does not parse.
Wayback Machine (archive.org) snapshots web pages over time, but AliExpress listings are rendered with JavaScript and live data calls. When Wayback crawls a product page, it captures the HTML shell without the dynamic price data. You will see the product description from six months ago but not the price. Useless for price tracking.
Manual spreadsheets work in theory and fail in practice. Nobody maintains a daily price log across 50 candidate products for 90 days. By the time the spreadsheet has enough data, the sourcing decision is already made.
The gap is real: AliExpress has no native price history, no third-party generalist tool covers it well, and the data only matters if it appears inline on the listing page while you are deciding. That is why AliShopping Tools built it directly into the listing-page overlay.
Install AliShopping Tools — Free, No Account
The price chart ships as part of the AliShopping Tools Chrome extension. Free, no account required, no account needed for any feature.
What you get:
- 90-day rolling price chart on every AliExpress product page
- Pattern detection annotations on suspicious price movements
- Winning Score (AI-rated 0-100 product viability)
- Supplier risk assessment and dispute-rate flagging
- Profit calculator with shipping, fees, and ad cost baked in
- Compare tab pulling similar products from multiple sellers
1-click install from the Chrome Web Store. The extension activates automatically the next time you open any AliExpress listing.
Install AliShopping Tools — free Chrome extension
Frequently Asked Questions
Does AliExpress have built-in price history?
No. AliExpress shows the current listing price and a seller-set strikethrough "original price" that has no requirement to be real. There is no chart, no graph, no historical view in the native AliExpress interface as of 2026. Price history requires a third-party tool that injects the data into the product page.
How far back does the chart go?
The default view is a 90-day rolling chart, with 30-day and 60-day zoom presets. For listings older than 90 days, the chart shows the most recent 90 days of data. For newer listings, the chart shows everything from the day the product was first indexed by AliShopping Tools.
Does it work on AliExpress mobile?
Not yet. The price chart loads through the Chrome desktop extension, which runs on the desktop web version of AliExpress (aliexpress.com and aliexpress.us). Mobile browser support and the AliExpress mobile app are on the roadmap but not shipped as of mid-2026. For now, run product research on desktop and place mobile orders separately if needed.
Is price history 100% accurate?
The chart reflects the listing's transacted display price (the actual price a buyer would pay), sampled daily and aggregated into a smoothed time series. It does not capture every micro-fluctuation within a single day, and it does not retroactively backfill data for listings that were not yet indexed. Accuracy is high for actively tracked listings (95%+ daily coverage) and decreases for very new listings or low-traffic products that took longer to enter the index.
The price on an AliExpress listing today is one data point in a 90-day story. Buyers and dropshippers who only see the data point lose to those who see the story. Install the extension, open any product page, and the chart loads in 2 seconds. From that point forward, no "78% off" banner will fool you again.
AliShopping Tools
See live AliExpress data in your browser.
Seller trust score, 90-day price history, and live promo codes — on every AliExpress product page. No account, free.
Ready to find winning products?
Try AliShopping Tools — 15 free AI tools for product research.
Quick answers
Frequently Asked Questions
1Does AliExpress have built-in price history?
No.
AliExpress shows the current listing price and a seller-set strikethrough "original price" that has no requirement to be real.
There is no chart, no graph, no historical view in the native AliExpress interface as of 2026.
Price history requires a third-party tool that injects the data into the product page.
2How far back does the AliExpress price chart go?
The default view is a 90-day rolling chart, with 30-day and 60-day zoom presets.
For listings older than 90 days, the chart shows the most recent 90 days of data.
For newer listings, the chart shows everything from the day the product was first indexed by AliShopping Tools.
3Does the AliExpress price history tool work on mobile?
Not yet.
The price chart loads through the Chrome desktop extension, which runs on the desktop web version of AliExpress.
Mobile browser support and the AliExpress mobile app are on the roadmap but not shipped as of mid-2026.
For now, run product research on desktop and place mobile orders separately if needed.
4Is AliExpress price history 100% accurate?
The chart reflects the listing's transacted display price, sampled daily and aggregated into a smoothed time series.
It does not capture every micro-fluctuation within a single day, and it does not retroactively backfill data for listings that were not yet indexed.
Accuracy is high for actively tracked listings (95%+ daily coverage) and decreases for very new or low-traffic products.
5How do I install and enable the AliShopping Tools price chart extension in Chrome?
You install the extension by visiting the Chrome Web Store, clicking “Add to Chrome,” and confirming the permission prompt.
After installation, the icon appears next to the address bar; clicking it toggles the price chart on or off for any AliExpress product page.
No account or payment is required, and the chart auto‑activates on every listing you open.
The extension stores its settings locally, so you only need to repeat the toggle once per browser profile.
Installation typically completes within 10 seconds on a 10 Mbps connection, and the tool works on Windows, macOS, and Linux Chrome builds.
6Can I export the AliExpress price chart for later analysis or reporting?
Yes, the price chart can be exported directly from the extension’s overlay.
Right‑click the chart area and select “Save as PNG” to capture a visual snapshot, or click the small download icon in the corner to generate a CSV file containing date, price, and discount columns for the full 90‑day window.
The CSV includes timestamps in UTC and can be opened in Excel or Google Sheets for trend analysis.
Exported files are saved to your default downloads folder, and no additional software is required.
This feature is handy for dropshippers who need historical pricing data for cost‑projection spreadsheets.
7Does the price chart extension noticeably slow down AliExpress page loading or increase bandwidth usage?
The chart adds a negligible load, typically under 200 ms on a standard 5 Mbps connection, because the extension injects a lightweight JavaScript widget that fetches price data from AliExpress’s public API.
The script size is about 45 KB and is cached after the first use, so subsequent page loads are virtually unchanged.
You can disable the chart in the extension’s popup if you prefer a completely clean page, but most users report no perceptible slowdown.
Bandwidth consumption is limited to a single JSON request per product page, which averages 12 KB of data.
8How can I use the price chart to decide the optimal time for a bulk dropshipping order?
To time a bulk order, look for the “Real Discount Window” pattern—where the chart shows a consistent dip of 10‑20 % lasting 7‑14 days—combined with a stable or descending trend over the previous 30 days.
If the chart displays a “Rising Trend” followed by a sharp “Spike & Crash,” it signals an upcoming price correction, making the post‑crash period the cheapest window.
Cross‑reference the chart with AliExpress sales events (e.g., 11.11) to avoid buying just before a scheduled promotion.
Using these visual cues, dropshippers can lock in lower sourcing costs and improve profit margins by up to 12 % per order.
9Is my browsing data shared with third parties when I use the AliShopping Tools extension?
The extension does not transmit personal browsing data to third parties; it only reads publicly available product pages to render the price chart.
All fetched price information is retrieved directly from AliExpress’s API and processed locally in your browser’s memory.
No cookies, identifiers, or usage logs are sent to external servers beyond the standard API calls required for price data.
The developer’s privacy policy states that any analytics are anonymized and stored solely for performance monitoring.
Therefore, you can safely use the tool without worrying about additional data leakage.
More from the blog
Koala Inspector Alternative 2026: Top Tools Compared
Best free Koala Inspector alternative 2026: a Chrome extension adding AliExpress price history, AI review analysis & supplier search Koala can't do — $0, no signup.
7 min read
AliShopping Tools: Your Complete Dropshipping Research Toolkit
A full walkthrough of every feature in AliShopping Tools — 11 AliExpress analysis tools, 4 Shopify spy tools, and 5 viral sharing features. All free, no signup required.
19 min read
AliExpress July 2026 Sale: Is the Discount Real? How to Check Before You Buy
AliExpress Summer Savings runs July 1–7, 2026. Here's how to verify whether the discount is genuine using 90-day price history — and which categories are worth buying during the sale vs. waiting out.
8 min read