












What Is a Winning Score for Dropshipping Products? (Complete Guide)
What Is a Winning Score for Dropshipping Products? (Complete Guide)
Quick answer: The Winning Score is a 0–100 composite rating for any AliExpress product, built from seven weighted signals on the listing itself — demand potential (21%), price attractiveness (17%), product rating (17%), social proof (17%), visual appeal (17%) and shipping quality (11%). A score of 75 or higher is labelled High Potential, 50–74 Medium Potential, and below 50 Low Potential.
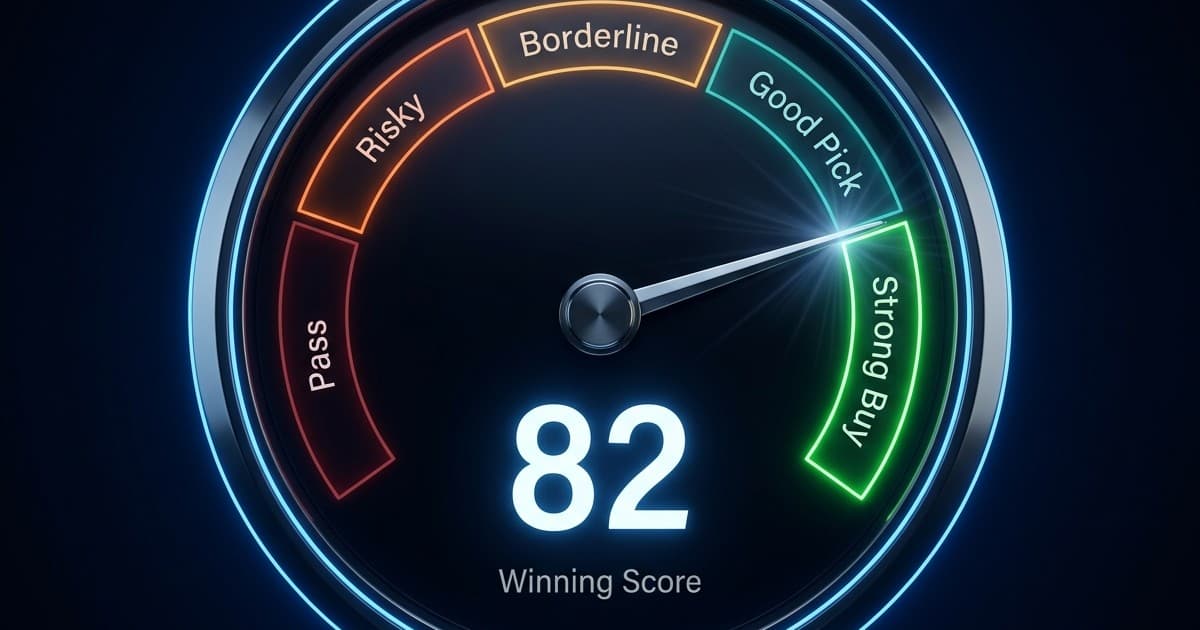
"It looks popular" is not a product research strategy. It is how dropshippers lose money.
Scroll through any dropshipping community on Reddit or Facebook and you will see the same pattern: someone posts a product they are excited about, and the entire discussion is vibes-based. "Looks like it could go viral." "I've seen this on TikTok." "The price seems good." These are observations, not scores. They are subjective and they are not comparable across products.
The fundamental problem with gut-feel product research is that it gives you no way to compare Product A against Product B in a systematic way. When everything is "looks good" or "feels promising," you cannot prioritize which product to test first, which to pass on, or which one to investigate further.
That is the narrow problem the Winning Score is designed to solve: turning the public signals on a listing into one comparable number.
This guide is Part 1 of the Product Scoring Masterclass series. By the end, you will understand what each of the six factors measures, what the score deliberately does not measure, how to read the three bands, and how to use it alongside your own judgment.
Why "It Looks Popular" Is Not a Scoring System
Before explaining what the Winning Score is, it is worth spending a moment on what it replaces — and why that replacement matters.
Consider the typical dropshipper's research process. They open AliExpress, sort by most orders, see a product with 25,000 orders, and think "people are clearly buying this." Then they check the price — $6.99 — and think "good markup potential." Then they look at the photos — clean, professional — and think "this will work."
None of that is wrong. But none of it is comparable. The same person looking at a second product an hour later applies a different mental weighting without noticing. The Winning Score fixes the weighting: every product is read through the same six signals, in the same proportions, every time. That is the whole value proposition — consistency, not omniscience.
What the Winning Score Measures: The 7 Factors
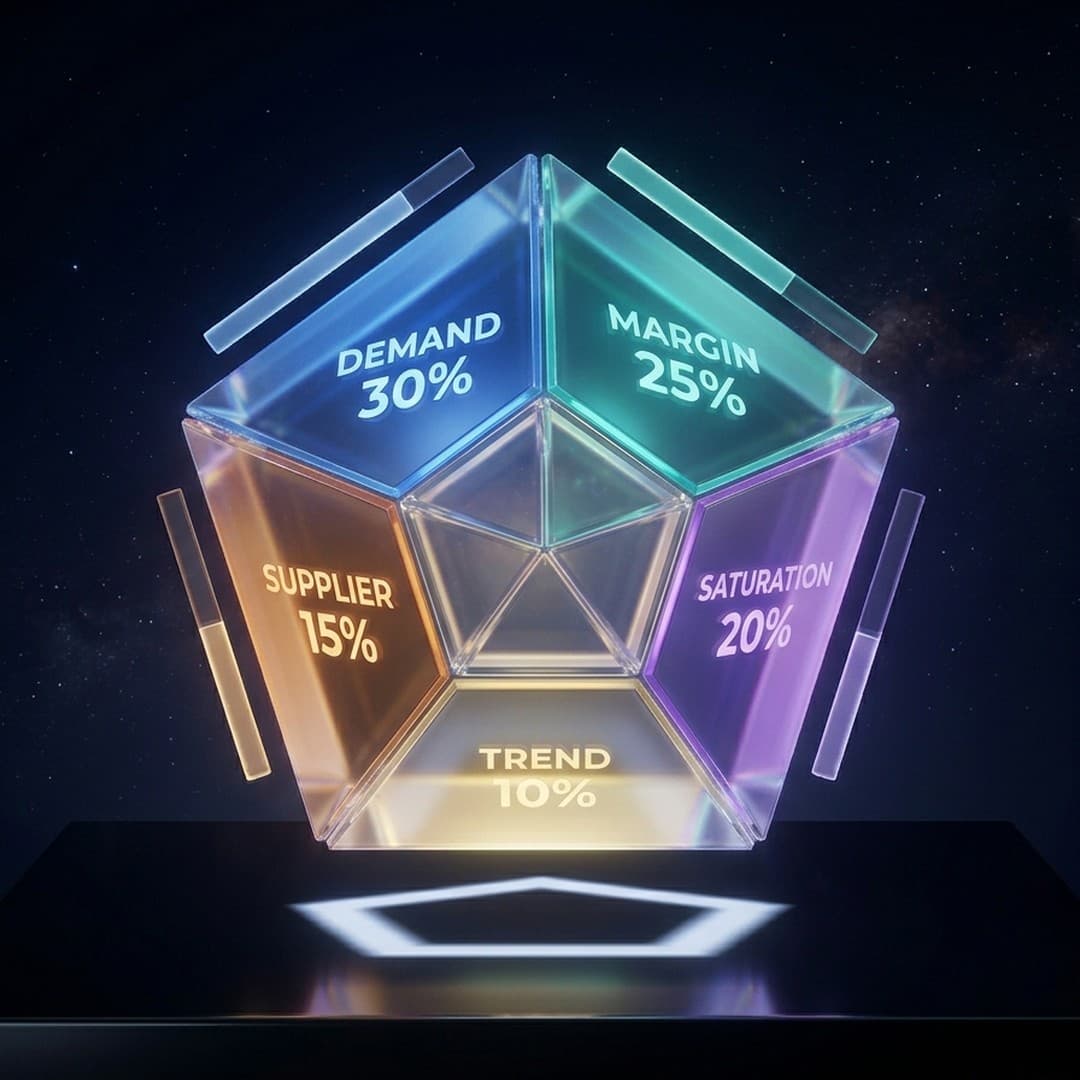
The Winning Score (0–100) is a weighted composite of six factors. Each factor is itself scored 0–100 and then contributes its weight to the total.
| Factor | Weight | What it reads from the listing |
|---|---|---|
| Demand Potential | 21% | Recent order volume on the listing |
| Price Attractiveness | 17% | Discount depth, plus whether the sale price sits in impulse-buy range |
| Product Rating | 17% | The listing's own product rating |
| Social Proof | 17% | Number of reviews on the listing |
| Visual Appeal | 17% | Whether there is a product video, how many images, whether there is a clean white-background image |
| Shipping Quality | 11% | Real shipping fee and delivery estimate to your destination country |
| Winning Score | 100% | Weighted composite, 0–100 |
Demand Potential (21%)
The heaviest single factor, and the only one above 17%. It reads the recent order volume reported on the listing and scores it on a logarithmic curve — so the distance from 100 orders to 1,000 is worth roughly as much as the distance from 1,000 to 10,000. That curve is deliberate: order counts span several orders of magnitude, and a linear scale would let one mega-listing flatten every other product to zero.
What it does not do is compare last month against three months ago. Demand Potential reads volume, not direction. Direction is a separate feature (see the Trend tab), and it is not folded into the Winning Score.
Price Attractiveness (17%)
Two inputs: how deep the current discount is, and whether the sale price lands in the impulse-buy zone. Cheaper products with a real discount score higher; expensive products with no discount score lower.
Read this factor carefully, because its name invites a misreading. It scores how attractive the price looks to a buyer — it does not calculate your margin. A $4 product with 60% off scores well here whether you can resell it for $30 or for $6.
Product Rating (17%)
The star rating on the listing itself, normalised to 0–100. When the listing exposes a 0–5 product score, that is used; otherwise the evaluation percentage is used. When a listing has no rating data at all, this factor falls back to a neutral 50 rather than a zero — which matters when you are reading a brand-new listing, because a neutral fallback is not the same thing as a good rating.
Social Proof (17%)
The number of reviews, on a log curve like demand. A listing with ten reviews and a listing with a thousand are genuinely different levels of evidence, and this factor is what separates them. Zero reviews scores zero here — no neutral fallback.
Visual Appeal (17%)
Purely structural: does the listing have a product video, how many images are on it, and is there a clean white-background image. It is a proxy for "this listing is well-built enough to run ads from," not an aesthetic judgement. Nothing in it inspects whether the photos are attractive, accurate, or stolen.
Shipping Quality (11%)
Real shipping fee and delivery-day estimate pulled for the destination country. Free or cheap shipping scores higher; faster delivery scores higher. Like Product Rating, this factor falls back to a neutral 50 when no shipping data comes back — so a 50 here can mean "average shipping" or "we could not read shipping," and those are not the same.
What the Winning Score Does Not Measure
This section matters more than the one above it, because most bad decisions come from assuming a score covers something it does not.
The Winning Score does not include:
- Your margin or profit. Nothing in the six factors compares supplier cost against a realistic retail price in your market. A high score with no viable margin is entirely possible.
- Market saturation or competition. The score reads one listing. It does not count how many other sellers run the same product, and it does not know what your ad costs will be.
- Trend direction. Demand Potential reads volume, not momentum. A declining product with a large historical order count can still score well.
- Supplier trustworthiness. Product Rating and Social Proof reflect the listing's public reception, not the seller's dispute rate, tenure, or how they behave when an order goes wrong.
- Counterfeit, IP, or operational risk. That is what the separate Risk Assessment is for (Part 2 of this series).
- Review authenticity. Social Proof counts reviews. It does not judge them.
None of that is a defect — it is scope. But it means the correct sentence is "this listing scores 78," never "this product will make money."
One more honest caveat: two of the six factors (Product Rating and Shipping Quality) fall back to a neutral 50 when the underlying data is missing. On a thin listing, part of the score is therefore an absence of evidence rather than evidence. The extension surfaces data-coverage flags alongside the score for exactly this reason — check them before trusting a number on a listing with no reviews and no shipping estimate.
See real delivery time to your country.
Per-seller shipping estimates and trust signals on every AliExpress product page. No account, free.
How to Read Your Score: 3 Bands
The score sorts into three bands, and there are only three:
High Potential (75–100)
The listing is strong across most of the weighted signals — real order volume, real reviews, a solid rating, and a listing built well enough to advertise from. This is the shortlist band.
What it earns you: a place on the research queue, not a purchase order. Everything the score cannot see — margin, competition, supplier behaviour — is still entirely unverified at this point.
Medium Potential (50–74)
Strong on some signals, weak on others. This is where most listings land, and the headline number is close to useless on its own here — a 62 built from strong demand and zero reviews is a completely different situation from a 62 built from moderate everything.
What to do: open the factor breakdown. Each factor carries its own label — Strong at 75 and above, Moderate at 50 and above, Weak at 25 and above, Very Weak below that — so you can see immediately which signal is dragging and decide whether that specific weakness is one you can work around.
Low Potential (0–49)
The listing is weak on the majority of its weighted signals. Usually that means little order volume, few or no reviews, or a thin listing with no video and few images.
What to do: in most cases, move on — not because the product is bad, but because you have no public evidence either way and validating it from scratch costs more than finding a listing that already has evidence. The exception is a genuinely new listing for a product you have independent reason to believe in; there, a low score is mostly telling you the listing is new.
Common Misconceptions About the Winning Score
"A 90 score means my product will sell."
It does not. Every input to the score comes from the listing's public data. It measures how strong the listing's evidence looks, not your store, your creative, your targeting, your price point, or whether the unit economics work at all.
"A low score means the product is bad."
Not necessarily. It often means the listing is new or thin — few reviews, no video, low order count. The score cannot distinguish "nobody wants this" from "nobody has seen this yet."
"I should only look at the final score, not the breakdown."
The breakdown is usually more useful than the total, because the same total can be assembled from very different factor profiles. Two listings at 62 can be nothing alike. Always read which factors are Strong and which are Weak before acting.
"High total orders = high Winning Score."
No. Order volume feeds Demand Potential, which is 21% of the total. The other 79% comes from price, rating, reviews, visuals and shipping. A listing with enormous order counts but no reviews, no video and expensive shipping will not score as highly as its order count suggests.
"The Winning Score tells me whether to buy."
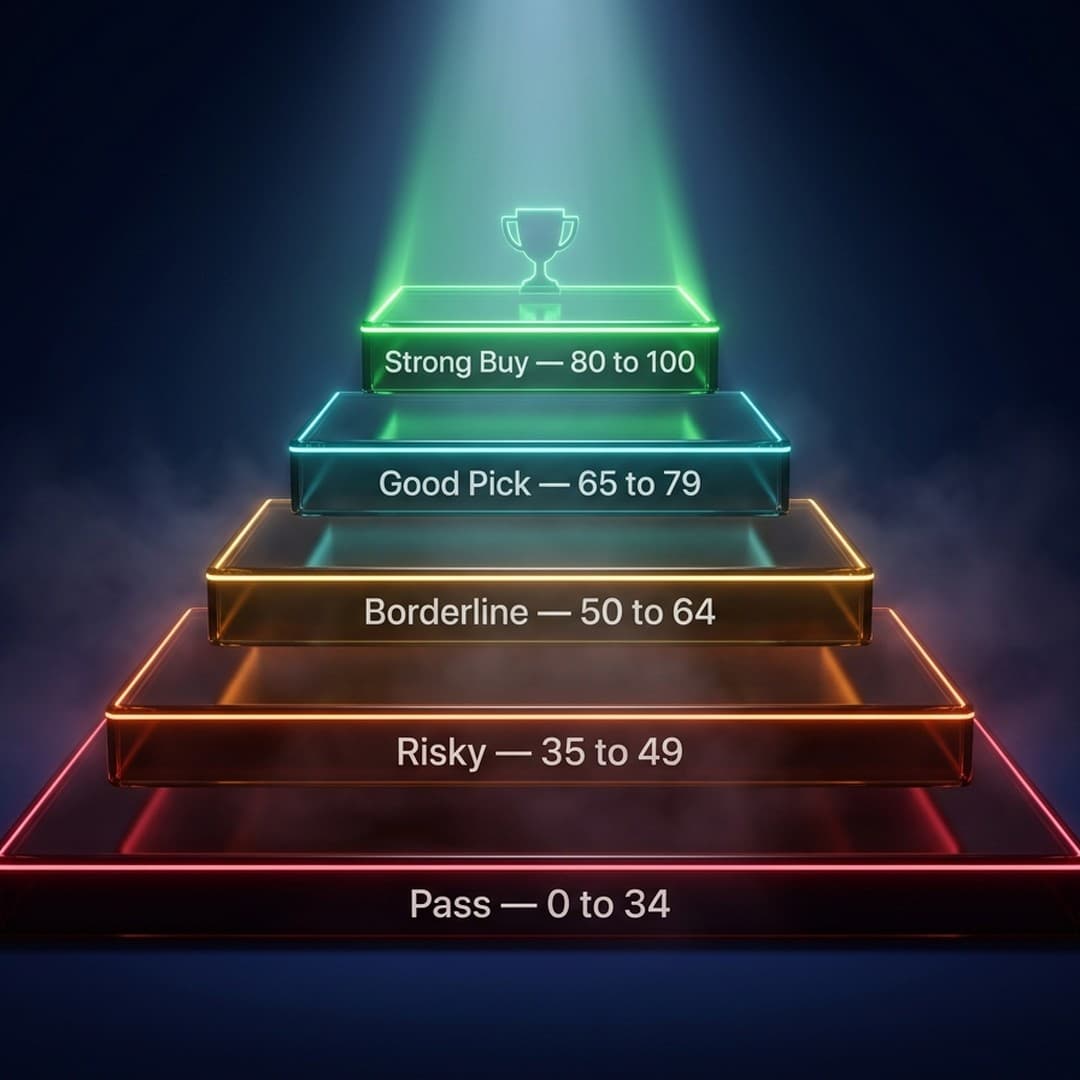
That is a different feature. The Verdict is the go/no-go read, and it has four states — Strong Buy, Buy Signal, Hold / Watch, and Pass. The Winning Score is the 0–100 composite that the Verdict draws on. Do not treat a Winning Score band as a verdict.
How to Use Winning Score Alongside Other Signals
AliShopping Tools shows the Winning Score on every AliExpress product page in real time. It works best as a fast first filter, not as the only filter.
A workable sequence:
- Identify a category with real consumer interest using sources outside AliExpress — Google Trends, TikTok, marketplace bestseller lists.
- Search AliExpress within that category.
- Use the Winning Score to sort and triage: High Potential listings go on the shortlist, Low Potential ones get skipped unless you have a specific reason.
- Open the factor breakdown on every shortlisted listing and check whether the score is carried by evidence or by neutral fallbacks.
- Do the work the score cannot do: calculate your actual margin including shipping, check how many competitors are running the product, message the supplier, and check ad libraries for existing creative.
- Test only what survives step 5.
The score eliminates obvious non-starters quickly so you spend your limited research time on realistic candidates. Everything that actually determines profit happens in step 5.
Illustrative Example: 3 Listings, 3 Bands
The three walkthroughs below are illustrative, not logged case studies. The factor scores are hypothetical, chosen to show how the weighting behaves — but each composite below is the actual weighted sum of the six numbers above it, so you can check the arithmetic yourself.
Listing A — lands in High Potential
| Factor | Score | Weight | Contribution |
|---|---|---|---|
| Demand Potential | 88 | 21% | 18.48 |
| Price Attractiveness | 82 | 17% | 13.94 |
| Product Rating | 90 | 17% | 15.30 |
| Social Proof | 85 | 17% | 14.45 |
| Visual Appeal | 80 | 17% | 13.60 |
| Shipping Quality | 70 | 11% | 7.70 |
| Winning Score | 83 — High Potential |
A listing with real volume, a large review base, a good rating and a well-built product page. Note that merely decent shipping barely dents the total — it is only 11% of the weighting. This is a shortlist candidate; it is not yet a validated product, because nothing above tells you the margin or the competition.
Listing B — lands in Medium Potential
| Factor | Score | Weight | Contribution |
|---|---|---|---|
| Demand Potential | 71 | 21% | 14.91 |
| Price Attractiveness | 35 | 17% | 5.95 |
| Product Rating | 78 | 17% | 13.26 |
| Social Proof | 60 | 17% | 10.20 |
| Visual Appeal | 55 | 17% | 9.35 |
| Shipping Quality | 50 | 11% | 5.50 |
| Winning Score | 59 — Medium Potential |
Solid demand and rating, but the price carries no meaningful discount and sits outside the impulse-buy range, and the listing is visually thin. The 50 on shipping may simply mean no shipping data was returned — worth checking before reading it as "average." This is the band where the headline number tells you almost nothing and the breakdown tells you everything.
Listing C — lands in Low Potential
| Factor | Score | Weight | Contribution |
|---|---|---|---|
| Demand Potential | 40 | 21% | 8.40 |
| Price Attractiveness | 20 | 17% | 3.40 |
| Product Rating | 62 | 17% | 10.54 |
| Social Proof | 25 | 17% | 4.25 |
| Visual Appeal | 35 | 17% | 5.95 |
| Shipping Quality | 40 | 11% | 4.40 |
| Winning Score | 37 — Low Potential |
Low volume, few reviews, a bare listing and no real discount. The rating is respectable, but at 17% weight one decent factor cannot lift the composite. The honest reading is not "bad product" — it is "no public evidence yet," which for most people is a reason to move on rather than a reason to investigate.
What Comes After the Score: Risk Assessment (Part 2)
The Winning Score reads how strong a listing's public signals are. It says nothing about how dangerous the execution is — and in dropshipping, danger comes in specific, predictable forms: counterfeit risk, shipping time problems, supplier fraud patterns, and review manipulation.
That is what the Risk Assessment is for. It is a separate scoring layer that runs alongside the Winning Score and flags specific operational risks the composite does not capture.
In Part 2 of this series — How to Read the Risk Assessment on Any AliExpress Product — we go through every risk flag, what triggers it, and what to do when you see one.

Next in This Series
This is Part 1 of the Product Scoring Masterclass series:
- Part 1: What Is a Winning Score? ← You are here
- Part 2: How to Read the Risk Assessment on Any AliExpress Product
- Part 3: The Complete Dropshipping Product Checklist Before You Order
Frequently Asked Questions
How is the Winning Score different from AliExpress's own star rating?
The star rating is one input into the Winning Score, not a substitute for it. Product Rating is 15% of the composite; the other 85% comes from order volume, price and discount, review count, listing visuals, commission rate and shipping. A listing can hold a 4.9-star rating and still score in Low Potential if it has almost no orders, almost no reviews, and a bare product page.
Can the Winning Score change over time for the same product?
Yes. Every factor is read from live listing data at the moment you view it — order volume, discount, review count, shipping estimate and rating all move. A score you saved weeks ago may no longer reflect the listing, so re-check before acting on it.
What is the minimum score worth testing?
There is no universal cutoff, and we would be inventing one if we gave you a number. The bands are the only thresholds that exist in the product: 75 and above is High Potential, 50–74 Medium, below 50 Low. Where you draw your own line depends on your budget and how much validation work you are willing to do on a Medium listing, since the score does not measure margin or competition either way.
Does a high Winning Score mean I can skip manual validation?
No — and this is the most expensive misreading of the score. Margin, competition, supplier reliability and ad economics are all outside the seven factors. A High Potential listing has only cleared the public-evidence bar; everything that determines whether you make money still has to be checked by hand.
How does the score handle seasonal products?
It does not adjust for seasonality at all. The seven factors read the listing as it is today, with no calendar awareness and no year-over-year comparison. A Christmas product evaluated in February will show depressed order volume and score accordingly. For seasonal items, treat the score as a snapshot and bring your own timing judgment.
Is the Winning Score the same as the Verdict?
No, they are two different readouts. The Winning Score is the 0–100 composite with three bands. The Verdict is a separate sourcing call with four states — Strong Buy, Buy Signal, Hold / Watch, and Pass. The TikTok Viral Score is a third, separate metric again. Do not read one as a synonym for another.
AliShopping Tools
See real delivery time to your country.
Per-seller shipping estimates and trust signals on every AliExpress product page. No account, free.
Product Tracker Free Beta
Track any AliExpress product’s real price, orders, stock & rating for 180 days. Data doesn’t lie. But discounts can.
Before you buy
Is this deal real? Check the price history before you buy.
Prices often spike just before a “sale.” See 180-day price history and fake discount detection — free, no account needed.
Verify on AliShopping Deals →Ready to find winning products?
Try AliShopping Tools — 15 free AI tools for product research.
Quick answers
Frequently Asked Questions
1What is the Winning Score for dropshipping products?
The Winning Score is a 0 to 100 composite metric that rates an AliExpress listing from seven weighted signals: demand potential (21%), price attractiveness (17%), product rating (17%), social proof (17%), visual appeal (17%) and shipping quality (11%).
A score of 75 or above is labelled High Potential, 50 to 74 Medium Potential, and below 50 Low Potential.
2What does a Winning Score of 75 or above mean?
75 and above is the High Potential band, the top of the three bands the score uses.
It means the listing is strong across most of the seven weighted signals — typically real order volume, a solid rating, a substantial review base and a well-built product page.
It is a shortlist signal, not a buy signal: the score reads the listing's public data only, so margin, competition and supplier reliability are all still unverified at that point.
3Can I rely on the Winning Score alone to select products?
No.
The score measures how strong a listing's public evidence looks, not whether the product will be profitable for you.
It does not calculate your margin, count competing sellers, estimate ad costs, judge supplier reliability beyond the listing's own rating, or read trend direction.
Use it to triage a long list quickly, then do the margin math, competitor check and supplier vetting by hand on whatever survives.
4Where do I see the Winning Score on AliExpress products?
The Winning Score appears in the AI Verdict tab of AliShopping Tools (free Chrome extension) on any AliExpress product page.
It shows the composite 0 to 100 score and its band, plus the breakdown of all seven factors with each factor's own score, weight and label — Strong at 75 and above, Moderate at 50 and above, Weak at 25 and above, Very Weak below that.
5How often does the Winning Score refresh for a product on AliExpress?
The score is computed from live listing data when you load the AliShopping Tools panel on a product page, rather than on a fixed schedule you can time.
Because its inputs include order volume, price and discount, review count and the shipping estimate, the number can shift as those change.
Don't treat a score you saved weeks ago as current — re-open the listing and re-read it before acting.
6Can I adjust the weighting of the factors in the Winning Score to match my store's niche?
No.
The six weights — demand potential 21%, price attractiveness 17%, product rating 17%, social proof 17%, visual appeal 17%, shipping quality 11% — are fixed, and there is no user-adjustable weighting in AliShopping Tools.
If your priorities differ, read the per-factor breakdown on the Verdict tab and weigh those individual scores yourself instead of expecting the composite to reflect your own emphasis.
7Does the Winning Score account for seasonality?
No.
None of the seven factors is calendar-aware, and the score makes no year-over-year comparison.
It reads the listing as it stands at the moment you view it, so a seasonal product evaluated out of season will show depressed order volume and score lower for that reason alone.
For seasonal items, treat the score as a snapshot of current public signals and apply your own timing judgment on top of it.
8How does the Winning Score compare to just looking at order volume or star rating?
Order volume and star rating are both inputs to the score, but neither dominates it.
Order volume feeds demand potential, which is 20% of the composite; the star rating feeds product rating, which is 15%.
The remaining 65% comes from price and discount depth, review count, listing visuals, and shipping.
That is why a listing with a huge order count but no reviews, no video and expensive shipping will not score as highly as its order count alone suggests.
9Does a supplier's minimum order quantity (MOQ) affect the Winning Score?
No.
MOQ is not one of the seven factors and there is no score penalty tied to it.
The score reads the listing price and discount as displayed.
If a supplier requires a higher minimum order quantity, check that on the listing yourself and factor it into your cash-flow planning — it changes your upfront capital risk in a way the score does not account for.
10Is the Winning Score the same as the Verdict?
No, they are separate readouts.
The Winning Score is the 0 to 100 composite with three bands: High Potential, Medium Potential and Low Potential.
The Verdict is the separate buy-or-not call, and it has four states — Strong Buy, Buy Signal, Hold / Watch, and Pass.
The TikTok Viral Score is a third, separate metric again.
Reading one as a synonym for another will lead you to the wrong conclusion.
Related Articles
- AI Product Scoring for Dropshipping: How It Actually Works in 2026dropshipping
- How to Read a Risk Assessment on Any AliExpress Product (2026 Guide)guides
- The 20-Point Dropshipping Product Checklist Before You Order (2026)dropshipping
- How to Validate a Dropshipping Product Before Spending on Ads (Free Framework)guides
- The Complete Dropshipping Product Research Guide (2026)dropshipping
- 7 Best AliExpress Research Tools 2026 (Free + Paid Ranked)products
Related Tools
More from the blog
AI Product Scoring for Dropshipping: How It Actually Works in 2026
AI product scoring replaces gut-feel product research with data-driven composite metrics. Learn how tools like Winning Score and Verdict work, what data feeds them, where they fall short, and how to use scores without over-trusting them.
How to Read a Risk Assessment on Any AliExpress Product (2026 Guide)
Master AliExpress supplier risk assessment: decode 6 risk dimensions, interpret red flags, and know exactly when to order a sample before you scale.
How to Do Product Research for Dropshipping: 7-Step Framework (Free Tools, 2026)
A repeatable 7-step product research framework for dropshippers in 2026 — from idea sourcing to live testing, using only free tools. No Ecomhunt subscription needed.