


Competition Analysis for Dropshipping: A Data-Driven Approach (2026)
Competition Analysis for Dropshipping: A Data-Driven Approach (2026)
Quick answer: To analyze dropshipping competition in 2026, track five metrics before entering any niche: saturation score, active seller count, top-3 seller share, price dispersion, and ad creative diversity. A niche is worth entering when fewer than 50 active sellers compete, no single player controls more than 40% of sales, and the price band is wide (20%+ spread). The free AliShopping Tools Chrome extension surfaces competition signals directly on any AliExpress product page. Install AliShopping Tools on the Chrome Web Store →
Most dropshipping businesses fail not because of bad products, but because sellers walk into markets they do not understand. They find a product with strong demand, decent margins, and good supplier ratings — then launch into a niche where 400 other sellers already compete on the exact same listing. Six weeks and several hundred dollars in ad spend later, they move on to the next product and repeat the cycle.
The difference between profitable dropshippers and the rest is rarely product taste. It is competition awareness. Sellers who systematically analyze competitive landscape before committing resources consistently outperform those who rely on gut feeling.
This guide breaks down the five competition metrics that matter most for dropshipping in 2026, explains how to interpret each one, and shows you how to distinguish between markets worth entering and markets to avoid.
<div class="quick-answer">To measure competition in a dropshipping niche, check three signals: (1) number of AliExpress sellers with 500+ reviews in the category, (2) Facebook/TikTok ads running on the product (use Facebook Ad Library or the ASTools competition tab), and (3) Google Trends 12-month trajectory. A niche is competitive but viable if trends are stable and seller count is under 50 with reviews concentrated in 5–10 sellers.</div>Why Competition Analysis Is the Most Overlooked Step in Product Research
Product research guides focus on demand signals: order counts, search volume, trend direction. These metrics answer "do people want this?" — necessary but insufficient. The equally important question: "how many sellers already serve that demand, and how entrenched are they?"
A product with 50,000 monthly orders sounds attractive until you discover 300 sellers compete for those orders, the top three control 70% of sales, and price wars have compressed margins to single digits. Meanwhile, a product with 5,000 monthly orders but only 15 active sellers and no dominant player might generate far more profit for a new entrant.
Competition analysis transforms product research from a one-dimensional demand hunt into a two-dimensional opportunity map. You stop asking "is this product good?" and start asking "is this product good for me to enter right now?"
The 5 competition metrics at a glance
| Metric | Green (enter) | Yellow (test small) | Red (skip) |
|---|---|---|---|
| Saturation score | Below 50 percent | 50-65 percent | Above 65 percent |
| Active seller count | Fewer than 30 | 30-80 | 80 plus |
| Top-3 seller share | Under 40 percent | 40-60 percent | Above 60 percent |
| Price dispersion | Wide (20 percent plus range) | Moderate | Tight (price war) |
| Ad creative diversity | Few ads from few brands | Moderate | Many ads, many brands |
The 5 Competition Metrics Every Dropshipper Should Track
1. Saturation Score (0-100%)
Saturation score measures how crowded a product category is relative to its demand. It accounts for the number of active sellers, listing density, and how aggressively those sellers compete on price and advertising.
How to read it:
- 0-25% (Low saturation): Few sellers, ample room for new entrants. Ideal entry conditions if demand signals are positive.
- 26-50% (Medium saturation): Healthy market with established sellers but room for differentiation. Most profitable niches sit here — enough demand to validate the market, not enough competition to crush margins.
- 51-75% (High saturation): Crowded. New entrants need a clear angle — better pricing, superior creatives, or an underserved sub-audience. Requires more capital and skill.
- 76-100% (Saturated): Red ocean. Price wars are active, margins are thin, and top sellers have locked in supplier relationships that new sellers cannot replicate. Avoid unless you have a structural advantage.
Key insight: Saturation is not static. A product at 70% saturation in January might drop to 45% by March if seasonal demand rises while seller count stays flat. Track saturation over time, not as a single snapshot.
2. Active Seller Count
The raw number of sellers actively listing a product or close variants. "Active" matters — many platforms show historical listings from sellers who stopped restocking months ago. You need the count of sellers who received orders in the past 30 days.
How to interpret it:
- Under 20 sellers: Niche or emerging product. Validate that demand exists — if order velocity is rising alongside a small seller count, you may have found an early-stage opportunity.
- 20-80 sellers: Moderate field. Focus on the top 10 — their pricing and positioning tell you what works.
- 80-200 sellers: Competitive. Unless total demand exceeds 10,000 orders/month, per-seller share is thin. You need strong creatives or a pricing edge.
- 200+ sellers: Commodity territory. Suppliers often sell direct, price is the only differentiator, and margins approach zero for independent sellers.
Context is everything. 50 sellers competing for 50,000 monthly orders is a fundamentally different situation from 50 sellers competing for 500 orders. Always pair seller count with demand volume.
3. Price Range and Distribution
The spread between the lowest and highest price for equivalent products reveals the market's pricing dynamics.
What price range tells you:
- Tight range (e.g., $12.99 - $15.99): The market has converged on a price. Buyers compare purely on reviews, shipping speed, or listing quality. Entering at the bottom of this range leaves almost no margin. Entering above it requires strong differentiation.
- Wide range (e.g., $8.99 - $34.99): The market has distinct tiers. Budget sellers, mid-range, and premium each serve different buyers. This is where opportunity lives — you can position between tiers or create a bundle that justifies a higher price point.
- Bimodal distribution (clusters at low and high): Indicates that the market has split into commodity and premium segments. The middle ground is often underserved — buyers who want better-than-basic but resist premium prices.
Practical application: If every seller prices between $13 and $15, your margin is structurally limited regardless of your cost basis. Look for products where the price range is wide enough that you can position at a point with healthy margins and a credible value story.
4. Top Seller Market Share
The percentage of total category sales captured by the top 3-5 sellers. This metric reveals market concentration and directly impacts your ceiling as a new entrant.
Reading the concentration:
- Under 30%: Fragmented market. No dominant player. New sellers can capture share without displacing an incumbent.
- 30-50%: Moderately concentrated. Leaders have advantages but are not unassailable. You can grow alongside them by targeting underserved segments.
- 50-70%: Concentrated. Leaders have significant review counts, ad budgets, and supplier lock-in. Entering requires a differentiated angle or willingness to compete on price.
- Over 70%: Oligopoly. These sellers control the market and can adjust prices to squeeze new entrants. Unless you bring something structurally different, steer clear.
Why this matters more than total seller count: A market with 200 sellers but fragmented share is often easier to enter than a market with 30 sellers where three of them control 80% of sales.
5. Entry Barriers
Entry barriers are the qualitative factors that make it harder for new sellers to compete. They include:
- Minimum order quantities (MOQs): If top sellers negotiate exclusive bulk pricing from factories, your per-unit cost may be 20-30% higher, making their price points unsustainable for you.
- Review moats: Products where the top listings have 5,000+ reviews create a trust barrier. Buyers default to the most-reviewed option. Overcoming this requires time and ad spend.
- Content requirements: Some product categories (fashion, beauty, tech accessories) require professional photography, video demonstrations, or UGC content to compete. If the top sellers have invested heavily in content, your entry cost rises.
- Certification or compliance: Products requiring safety certifications or regulatory compliance deter casual sellers. Paradoxically, this often makes these categories more attractive — fewer competitors willing to do the work.
- Advertising cost floor: In some categories, the cost per click is so high that only sellers with existing cash flow can profitably advertise. Check estimated CPC/CPA benchmarks before entering.
When Competition Is Too High vs. Healthy
Not all competition is bad. In fact, zero competition is often a warning sign — it may indicate zero demand.
Healthy competition looks like:
- 20-60 active sellers with fragmented market share
- Saturation score between 25-50%
- A price range wide enough to support a 40%+ margin at mid-tier positioning
- No single seller dominating more than 20% of orders
- Positive demand trend (growing or stable search volume)
Excessive competition looks like:
- 150+ sellers with price convergence within a narrow band
- Saturation score above 70%
- Top 3 sellers holding more than 60% of orders
- Average margins below 20% after advertising costs
- Flat or declining demand with no seasonal uptick expected
The sweet spot: Products that show growing demand (trending upward) combined with moderate seller counts and fragmented market share. The demand is pulling new buyers into the category faster than new sellers are entering. This imbalance creates a window of opportunity — and the sellers who identify it early capture disproportionate share.
How AliShopping Tools Surfaces These Metrics Automatically
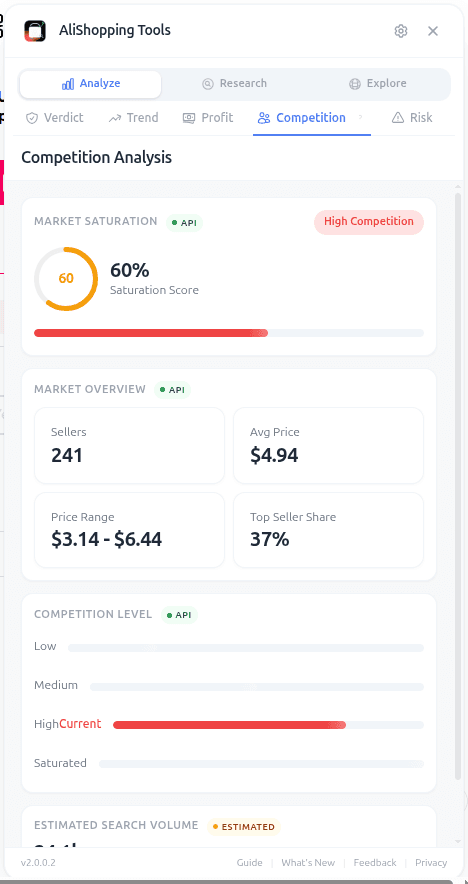
Gathering competition data manually takes hours per product. The AliShopping Tools Competition tab automates this entire analysis and delivers it in seconds while you browse AliExpress.
When you open any product page with the AliShopping Tools extension installed, the Competition tab provides:
- Saturation Score (0-100%): Calculated across the product's category with clear labeling: low, medium, high, or saturated. No ambiguity — you see exactly where this market stands.
- Market Overview: Total active seller count, average price, full price range, and top seller share percentage in a single view.
- Saturation Distribution Chart: A visual bar chart breaking down what percentage of the competitive field falls into each saturation tier. You can see at a glance whether competition is concentrated at the top or spread evenly.
- Estimated Search Volume: Monthly search volume for the product category, giving you the demand side of the equation right alongside competition data.
This data sits alongside the other analysis tabs — Verdict (overall product scoring), Trend (demand direction and TikTok viral potential), Profit (margin simulation), and Risk (supplier assessment) — so you never need to leave the product page to make a complete decision.
Instead of spending two hours researching a single product's competitive landscape, you spend five seconds. You can evaluate 50 products in the time it previously took to evaluate two — and volume of analysis directly translates to quality of product selection.
Browse trending low-competition products now at astools.app/en/discover — the Discovery feed surfaces products with strong demand signals and low saturation scores, pre-filtered by our competition model. Daily Deals are at astools.app/en/daily-deals.

Case Study: Saturated vs. Unsaturated — Same Category, Different Outcomes
Consider two products in the pet accessories category, both with similar demand signals.
Product A: Automatic Pet Water Fountain
- Saturation Score: 82%
- Active Sellers: 230+
- Price Range: $14.99 - $18.99 (tight)
- Top 3 Seller Share: 58%
- Estimated Monthly Orders: 35,000
On the surface, 35,000 monthly orders looks attractive. But over 230 sellers compete in a narrow $4 price band. The top three — with thousands of reviews and optimized listings — capture nearly 60% of orders. That leaves roughly 14,000 orders split among 227 sellers: about 62 each. At $16 average with 30% margin, that is roughly $300/month profit before ad costs. The math does not work for a new entrant.
Product B: Collapsible Pet Travel Bowl with Built-in Clip
- Saturation Score: 34%
- Active Sellers: 28
- Price Range: $6.99 - $19.99 (wide)
- Top 3 Seller Share: 24%
- Estimated Monthly Orders: 4,200
Order volume is eight times smaller than Product A. But the competitive dynamics are inverted. Only 28 sellers, no dominant player. The wide price range means you can position at $12.99-$14.99 with healthy margins. Capturing 5% of orders — 210 units/month — at 50% margin generates roughly $1,350/month in profit. With a fragmented market, growing to 10-15% share is realistic within 60-90 days.
The verdict: Product B, despite lower total demand, represents a significantly better business opportunity. The competition metrics revealed what demand metrics alone could not.
Frequently Asked Questions
What saturation score is too high for a new dropshipper to enter?
Above 70% saturation is generally too risky for newcomers. You would need either a unique product angle, an established audience, or a significantly lower cost basis to compete. Products scoring 25-50% saturation offer the best balance of validated demand and room for new entrants.
How do I compete in a market where a few sellers dominate?
Focus on differentiation rather than direct competition. Target a sub-audience the dominant sellers ignore, bundle products for higher perceived value, create better ad content, or position at a different price tier. AliShopping Tools' Competition tab shows you exactly where the top sellers cluster so you can find gaps in their positioning.
Does low competition always mean a good opportunity?
No. Very low competition (under 5 active sellers) combined with low order volume often signals weak demand, not an untapped goldmine. The ideal scenario is moderate competition (20-60 sellers) with growing demand and no single dominant player. This confirms the market works while leaving room for new entrants.
How often should I re-check competition on products I already sell?
Monthly at minimum. Saturation levels shift as new sellers enter and existing ones exit. A product you started selling at 35% saturation can climb to 60% within a few months if it goes viral. Monitoring competition regularly lets you adjust pricing, increase ad differentiation, or start researching replacement products before margins collapse.
Start Making Competition-Informed Decisions
Every product you evaluate without competition data is a partial analysis. You see half the picture and hope the other half works out. More often than not, you discover the competitive reality only after investing time, money, and inventory.
Checking saturation, seller count, price distribution, market concentration, and entry barriers before committing to a product is what separates sustainable dropshipping operations from those that churn through products hoping to get lucky.
AliShopping Tools puts all five metrics on every AliExpress product page you visit — free, instant, no account required. Install the extension, open the Competition tab, and start seeing the full picture before your next product decision.
Install AliShopping Tools Free — Check Competition on Any Product
AliShopping Tools
See live AliExpress data in your browser.
Seller trust score, 90-day price history, and live promo codes — on every AliExpress product page. No account, free.
Ready to find winning products?
Try AliShopping Tools — 15 free AI tools for product research.
Quick answers
Frequently Asked Questions
1What saturation score ranges are good or bad for dropshipping?
The post uses four bands: 0–25% is Low saturation with few sellers and ample room for new entrants (ideal when demand signals are positive), 26–50% is Medium — a healthy market where most profitable niches sit with enough demand but not enough competition to crush margins, 51–75% is High and requires a clear differentiation angle plus more capital, and 76–100% is Saturated (red ocean) — avoid unless you have a structural advantage.
Saturation is not static; it shifts over time as seasonal demand moves and seller count changes.
2How should I interpret active seller count on AliExpress?
Per the post's bands: under 20 sellers is niche or emerging — validate demand first; 20–80 sellers is moderate — focus on the top 10 to see what pricing and positioning works; 80–200 sellers is competitive and you need strong creatives or a pricing edge unless demand exceeds 10,000 orders/month; 200+ sellers is commodity territory where suppliers sell direct, price is the only differentiator, and margins approach zero for independents.
Always pair seller count with demand volume — 50 sellers on 50,000 orders is very different from 50 sellers on 500 orders.
3Why does competition analysis matter more than demand signals alone?
The post's framing: demand signals (order counts, search volume, trend direction) only answer "do people want this?" — necessary but insufficient.
The second question is "how many sellers already serve that demand, and how entrenched are they?" A product with 50,000 monthly orders but 300 sellers, top-three controlling 70%, and compressed margins is worse than 5,000 orders with 15 active sellers and no dominant player.
Competition analysis turns product research into a two-dimensional opportunity map rather than a one-dimensional demand hunt.
4How can I calculate the saturation score for a niche product using AliShopping Tools?
You calculate the saturation score by dividing the number of active listings by the estimated monthly search volume and multiplying by 100.
First, pull the total active listings for your product from AliShopping Tools (or AliExpress) over the past 30 days.
Next, obtain the keyword’s monthly search volume from Google Keyword Planner or Ahrefs.
Apply the formula: (active listings ÷ monthly searches) × 100.
A score below 50 % suggests low competition, while above 70 % indicates a crowded niche.
Refresh the data weekly to catch sudden spikes caused by viral trends or new supplier launches.
5What does a high ad density metric indicate for a dropshipping product, and how should I respond?
A high ad density signals that many competitors are pouring money into paid advertising for that product, which tends to compress margins and raise customer-acquisition costs.
There's no universally agreed threshold for what counts as "ad-intensive" — it depends on the platform and niche — so treat any specific ads-per-impression cutoff as illustrative.
If a product looks heavily advertised, leaning on organic traffic strategies (SEO, influencer outreach, content) or seeking a less-saturated micro-niche is a reasonable response.
6When is the best time of year to target products with a price dispersion over 20%?
Wide price dispersion (a large gap between the cheapest and priciest comparable listings) tends to widen further around high-demand seasonal windows like back-to-school and the holiday season, since buyers become more willing to pay a premium.
The exact seasonal uplift varies by category and year, so treat any specific percentage figure as illustrative rather than a benchmark.
Monitoring price spread on AliShopping Tools over a few weeks and launching when the gap is clearly widening is a more reliable signal than targeting a fixed calendar date.
7How does the top‑3 seller share affect entry risk for a dropshipping product?
When a small number of sellers control most of a category's sales, entry risk tends to be higher, since those dominant players can typically out-spend on ads and negotiate better shipping terms.
A more fragmented market (no single seller or small group dominating) generally gives new entrants more room to gain traction.
Exact percentage thresholds for "high risk" vs.
"fragmented" aren't something we can state as a fixed rule — use top-seller concentration as one directional input alongside demand and margin, not a strict cutoff.
8Can I use the five competition metrics together to build a scoring model, and what weighting works best?
You can combine saturation, active seller count, top-seller concentration, price dispersion, and ad density into a simple weighted scorecard to prioritize products — normalizing each metric to a comparable scale and giving more weight to the signals that matter most for your niche is a reasonable approach.
There's no single "correct" weighting that applies universally; the right balance depends on your category and risk tolerance, so treat any specific weighting split as a starting template to adjust, not a proven formula.
More from the blog
How to Measure Competition in a Dropshipping Niche (4-Signal Framework)
Seller count alone lies. Learn the 4 real signals that reveal true dropshipping niche competition — review velocity, price compression, ad saturation, and supplier concentration — plus a Competition Score framework to make faster go/no-go decisions.
How to Choose a Dropshipping Niche in 2026: The Complete Decision Guide
How to choose a dropshipping niche in 2026: the 4-criteria framework (demand, competition, margins, passion), 5 niches that still work, 3 niches to avoid, and a 48-hour validation checklist. No guru opinions — just repeatable process.
AI Product Scoring for Dropshipping: How It Actually Works in 2026
AI product scoring replaces gut-feel product research with data-driven composite metrics. Learn how tools like Winning Score and Verdict work, what data feeds them, where they fall short, and how to use scores without over-trusting them.