AliExpress Price History: How to Check Any Product's Real Price (2026)
AliExpress Price History: How to Check Any Product's Real Price (2026)
Quick answer: AliExpress does not show price history natively. To check a product's real price over time, install AliShopping Tools (free Chrome extension) — it overlays a 90-day price chart directly on every AliExpress product page. Compare the current "sale" price against the chart's baseline to see if the discount is real or manufactured. If the price was the same or higher two weeks ago and just got relabeled as a "deal," it is not a deal.
AliExpress runs promotions constantly. Summer Sale, 11.11, Brand Week, flash deals — there is always a banner promising a discount. The problem is that AliExpress only shows you the current price and the seller-set "original price." There is no built-in way to see what the product actually sold for last week, last month, or before the sale started.
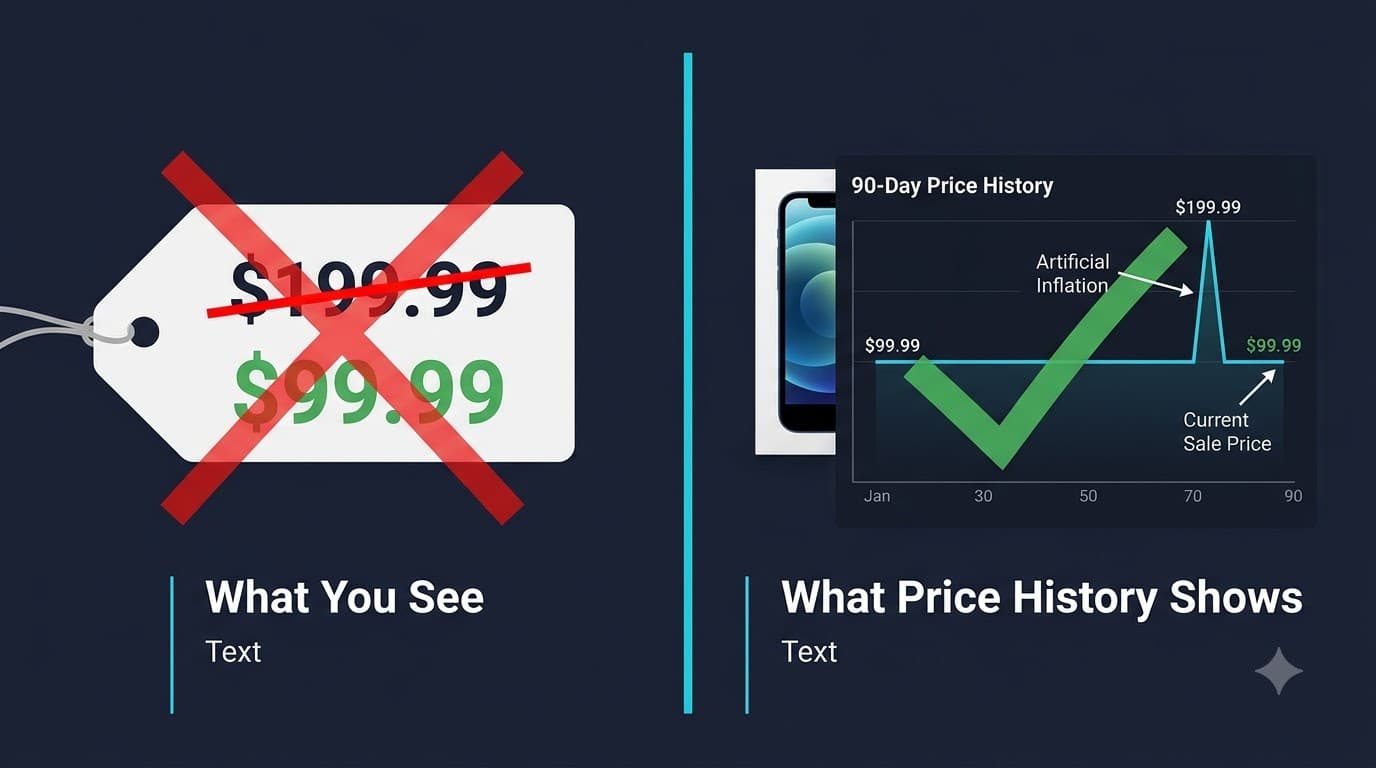
That matters because the "original price" is whatever the seller decides to type in. If a seller raises the original price from $15 to $30 the week before a sale, then lists the product at $14.99 with a "50% off" badge, the platform displays it as a massive deal. In reality, you are paying roughly the same price as always — or sometimes more.
Checking price history before buying is the only reliable way to know if a sale price is genuine. This guide covers how to do it, how to read the chart, and what the data tells you (and what it does not).
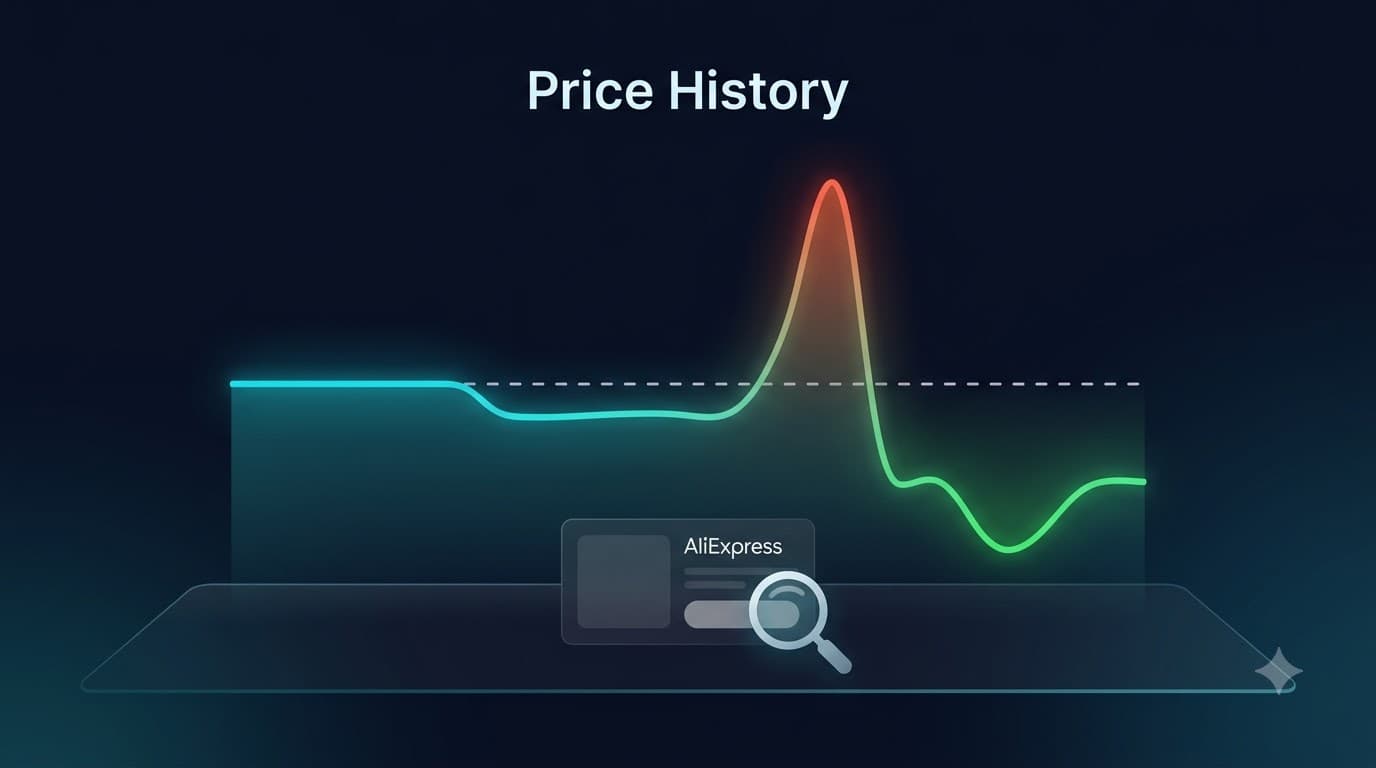
Why price history matters on AliExpress
AliExpress sellers set their own prices, including the "original" or "list" price that appears crossed out next to the sale price. Unlike regulated retail markets where reference pricing has legal constraints, AliExpress sellers can change the original price at any time without disclosure.
This creates a specific problem during major sales events:
The pre-sale price inflation pattern
Leading up to major events like 11.11, Summer Sale, or 618, many sellers raise their listed original price. They do this so the percentage discount looks larger when the sale goes live. The actual selling price may not drop at all — the "discount" is cosmetic.
This is not a rare tactic. Anyone who has tracked AliExpress prices across multiple sale events has seen it happen repeatedly. Without a historical record, though, you cannot prove it on a per-product basis — you only have the seller's word for what the "original price" was.
Why the AliExpress "original price" is not a reference point
The crossed-out price on an AliExpress listing is not a historical high, a manufacturer's suggested retail price, or a price the product ever actually sold at. It is a field the seller fills in. Some sellers set it accurately. Others inflate it by design. There is no platform verification.
This is why price history — the actual recorded selling price over time — is the only reference point that means anything. If the product has been selling for $12 for the past two months and is now listed at $11.50 during a "70% off" event, the real discount is about 4%, not 70%.
How to check AliExpress price history with AliShopping Tools
AliExpress does not offer a built-in price history feature. To see how a product's price has changed over time, you need a third-party price tracker that runs as a browser extension. AliShopping Tools is a free Chrome extension that adds a price history chart to every AliExpress product page.
Step 1: Install the extension
Go to the Chrome Web Store and click "Add to Chrome." The extension installs in a few seconds. No account creation, login, or payment is required — the price history feature works immediately.
Step 2: Open an AliExpress product page
Navigate to AliExpress and open any product listing. The extension activates automatically — you do not need to click anything or open a separate dashboard. It detects the product page and loads the relevant data.
Step 3: Find the price history chart
Look for the AliShopping Tools panel on the product page. The price history tab displays a chart showing the product's recorded price over time. The chart includes:
- A price line — the product's actual listed price at each recorded point
- A baseline (median) line — a reference showing the product's typical price over the tracked period
The chart appears directly on the product page, so you see the history in context alongside the current listed price and discount badge.
Step 4: Compare the current price to the baseline
This is the step that actually saves you money. Look at where the current price sits relative to the baseline:
- Current price at or below the baseline — the discount is likely genuine. The product is cheaper than its typical selling price.
- Current price above the baseline despite a "discount" badge — the discount is cosmetic. The original price was inflated to create the appearance of a deal.
- Current price near the baseline — the product is at its normal price. There is no meaningful discount, regardless of what the badge says.
Step 5: Decide whether to buy or wait
If the current price is near the lowest point on the chart, buying now makes sense. If the chart shows a downward trend, waiting a few days or weeks may get you a better price. If the chart shows a spike followed by the current "sale," the deal is not real — wait for the price to return to its normal level.
How to read a price chart: the three patterns that matter
Not every price chart tells the same story. Here are the three most common patterns and what each one means for your buying decision.
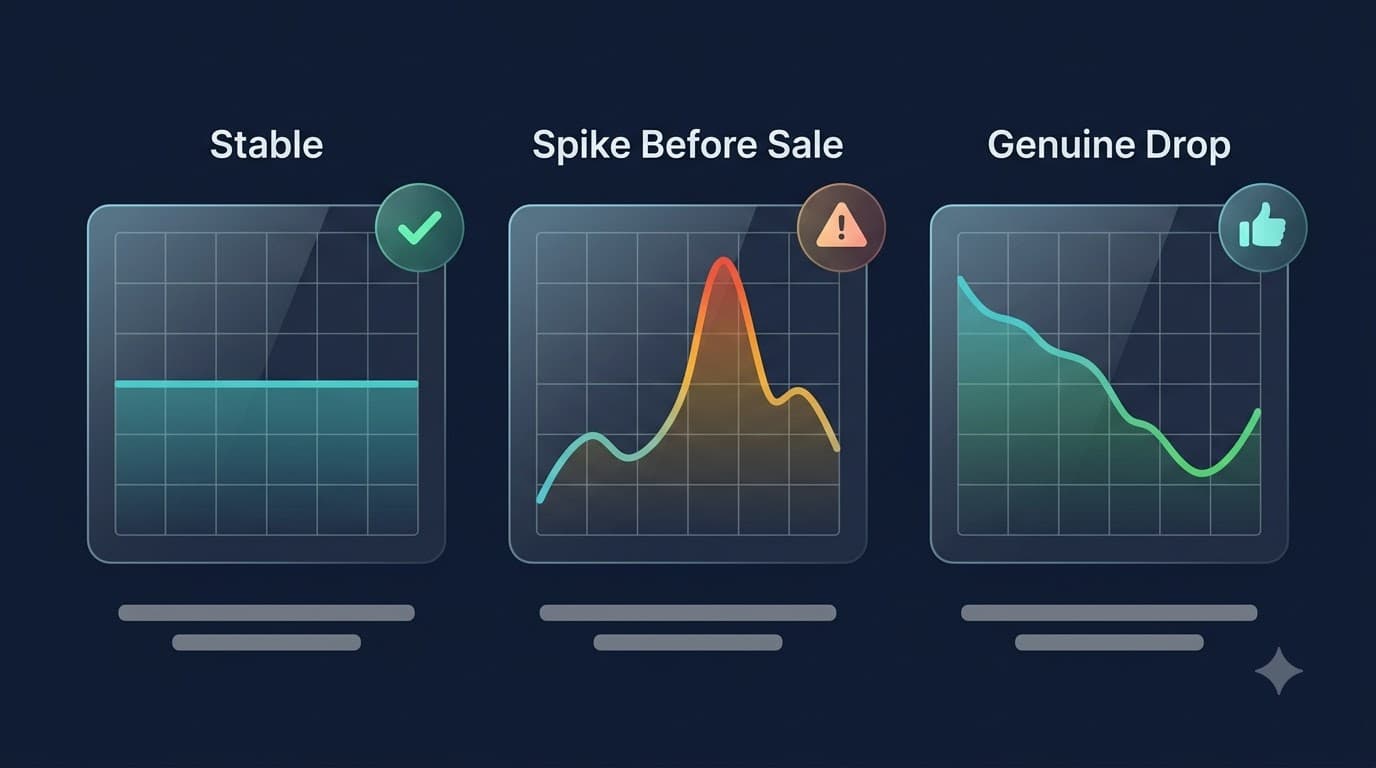
Pattern 1: Stable price (flat line)
The price has stayed roughly the same for weeks or months. If the product currently shows a "sale" badge but the chart is flat, the discount is either very small or entirely manufactured from an inflated original price.
What to do: Compare the current selling price to the flat line. If they match, there is no discount. If the current price is slightly below the flat line, the discount is real but small — decide based on whether the product is worth it at that price, not based on the percentage shown.
Pattern 2: Spike before sale (inflated original price)
The price jumps up shortly before a sale event, then the "discount" brings it back down to approximately where it was before. This is the pre-sale inflation pattern described above.
What to do: Ignore the discount percentage. Compare the current price to the pre-spike price. If they are similar, there is no real savings. Wait for the price to drop below the pre-spike level before buying.
Pattern 3: Genuine price drop
The price drops below the baseline and stays there, or drops to a new low. This is a real discount — the product is cheaper than its typical selling price.
What to do: This is a good time to buy, especially if the drop coincides with a major sale event (when sellers sometimes offer genuine loss-leader deals to drive store traffic and reviews). Compare the drop magnitude to the baseline — a small dip may not be worth rushing for, but a significant drop below the long-term median is worth acting on.
What the 90-day chart tells you — and what it does not
The 90-day price history window is useful for specific things and limited for others. Understanding both helps you use the data correctly.
What it tells you
- Whether a current "sale" price is real — the primary use case. You can see what the product actually sold for recently and whether the discount is genuine.
- Short-term pricing trends — whether the price has been rising, falling, or stable over the past three months.
- Pre-sale manipulation — price spikes in the days or weeks before a sale event are clearly visible on a 90-day chart.
- The product's recent baseline price — the median line gives you a reference point for what "normal" costs for this product.
What it does not tell you
- Year-over-year seasonal patterns — 90 days does not cover a full year. If a product is cheaper every January because of post-holiday surplus, a 90-day chart in June will not show that pattern.
- The all-time lowest price — the chart shows the lowest price in the past 90 days, not the product's all-time low. The product may have been cheaper six months ago.
- Future price movements — the chart shows history, not predictions. A product at its 90-day low might drop further, or it might rebound.
- Prices across variants — the chart typically tracks the default or most popular variant. Different sizes, colors, or configurations may have different pricing patterns.
For products where year-over-year patterns matter (seasonal items, electronics with release cycles), the 90-day window is a useful check against manufactured discounts but not a complete picture of the product's pricing lifecycle.
When to buy: using price history to time your purchase
Price history does not predict the future, but it gives you enough context to make a better decision than buying blind.
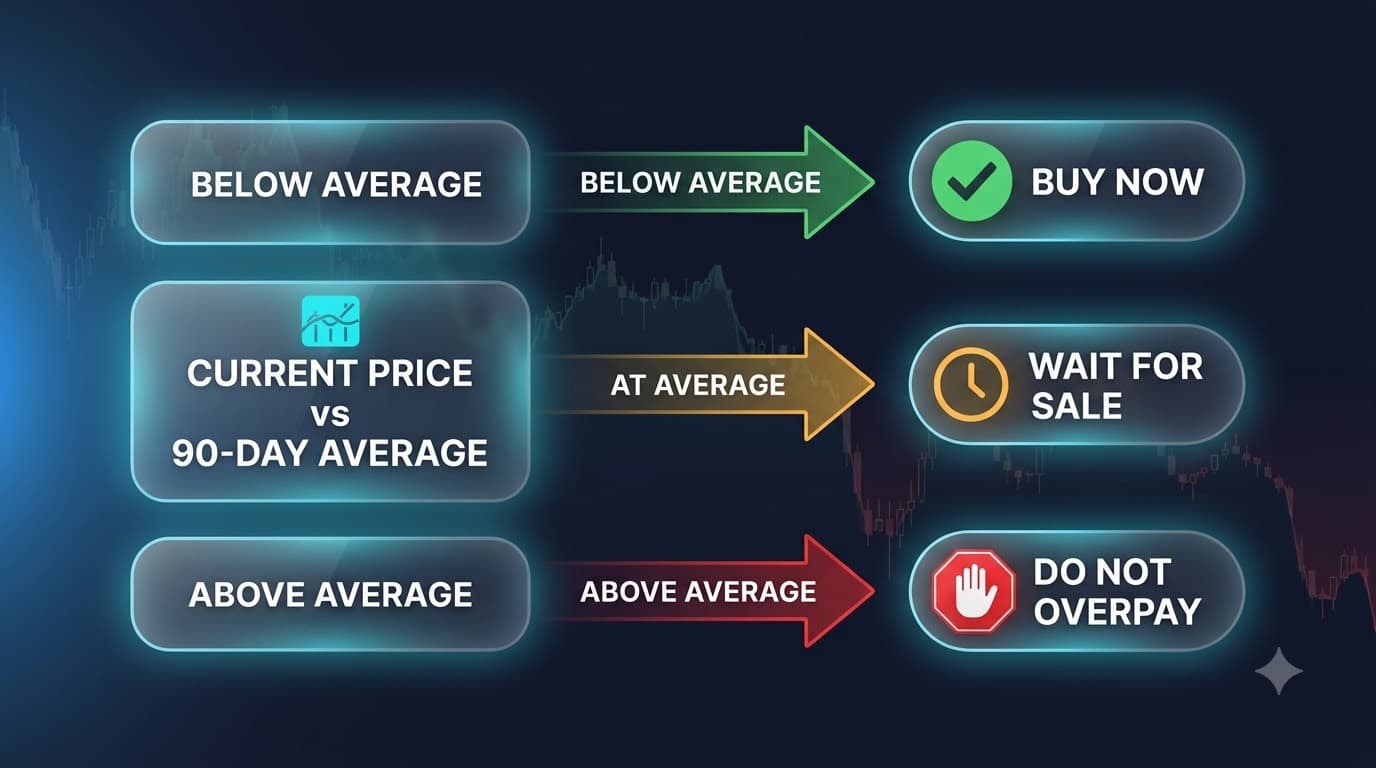
Buy now if:
- The current price is at or near the 90-day low on the chart
- The price has been stable and the current sale brings it below the baseline
- You need the product soon and the price is at or below the median — timing the absolute bottom is not worth weeks of waiting for most purchases
Wait if:
- The chart shows a clear downward trend that has not leveled off — the price may still be dropping
- A major sale event (11.11, Black Friday, 618) is coming within the next 2-4 weeks — genuine discounts during these events can be meaningful
- The current "sale" price is at or above the baseline — the discount is cosmetic, and the price will likely return to this level or lower after the promotion ends
Do not overpay:
- If the chart shows a spike followed by a "discount" back to normal, you are not getting a deal — you are paying the regular price
- If the current price is above the 90-day baseline and marked as a "sale," walk away or wait
How AliShopping Tools compares to AliTools for price tracking
AliTools is another Chrome extension that tracks AliExpress prices. If you are deciding between the two (or considering using both), here is an honest comparison.
Where AliShopping Tools works well
- Free, no account required — the price history chart works immediately after installation with no sign-up
- Integrated with other buying signals — price history is one tab alongside seller trust scores, review analysis, and other research tools, so you get a complete picture on one panel
- Clean 90-day chart with a baseline (median) line for quick reference
Where AliTools has an advantage
- Longer price history database — AliTools has been tracking AliExpress prices for years and can show price data going back further than 90 days for products it has tracked. If you need to see year-over-year pricing patterns or all-time lows, AliTools has more historical depth.
- Price drop alerts — AliTools lets you set notifications for when a product drops below a target price, which is useful if you are watching specific items over weeks or months.
The practical difference
For the most common use case — checking whether a current discount is real before buying — both tools give you the answer. The 90-day chart in AliShopping Tools is sufficient to spot pre-sale manipulation and compare the current price to recent history. AliTools' longer history adds value if you are tracking seasonal items or want to see multi-year pricing trends.
If you primarily need a quick price check alongside other buying research (seller trust, reviews), AliShopping Tools bundles everything in one extension. If historical depth is your primary need and you want the longest possible price record, AliTools is worth installing specifically for that.
There is no conflict in using both — they are separate Chrome extensions that run independently on AliExpress product pages.
FAQ
Does AliExpress show price history?
No. AliExpress does not display price history natively. The platform only shows the current price and the seller-set "original price," with no timeline of past prices. To see a price chart on any AliExpress product, you need a third-party price tracker extension like AliShopping Tools or AliTools.
How far back does AliExpress price history go with AliShopping Tools?
AliShopping Tools shows up to 90 days of price history for most AliExpress products. New listings or low-traffic products may have a shorter history if they have not been tracked long enough. Products with higher visibility on AliExpress (bestsellers, trending items, high search volume categories) typically have the full 90-day data available.
Is the AliExpress price tracker free?
Yes. The price history feature in AliShopping Tools is completely free. There is no premium tier, no trial period, and no account creation required for the price history chart. Install the extension and the chart appears automatically on AliExpress product pages.
Can I check AliExpress price history on my phone?
The price history chart is a Chrome extension feature, so it runs on desktop Chrome — not inside the AliExpress mobile app or mobile browsers. To check a product's price history from your phone, you can open the AliExpress desktop site in Chrome using the "Request desktop site" option, though the chart is easier to read on a full-size screen.
Does the price chart include shipping costs?
No. The price chart tracks the item's listed price only. Shipping costs are not included in the historical data because shipping rates vary by destination, carrier, and ongoing promotions — including them would distort the trend line. If you want the total landed cost, add the current shipping estimate manually when comparing against the chart's baseline.
How can I tell if an AliExpress discount is fake?
Check the product's price history chart. If the price was stable for weeks and then spiked up right before the sale event, followed by a "discount" that brings it back to roughly the same level, the discount is manufactured. A genuine discount shows the current price dropping below the product's baseline (median) price on the chart. The 90-day view makes this pattern immediately visible.
The bottom line
The "original price" on an AliExpress listing is not a fact — it is a number the seller controls. The only way to know if a discount is real is to see what the product actually sold for before the sale started. A 90-day price chart gives you that context in seconds.
Install AliShopping Tools, check the price chart before you buy, and compare the current price to the baseline. If it is at or below the median, the deal is probably real. If it is the same as last month despite a "70% off" badge, keep your money and wait.
Install AliShopping Tools — check price history on any AliExpress product for free → — price history, seller trust scores, review analysis. Free, no account required.
Related Buyer Guides
- How to Spot Fake AliExpress Discounts — deep dive on discount manipulation tactics
- AliExpress Scams to Avoid — 9 common scams and red flags to watch for
- How to Check AliExpress Seller Trust — seller verification before you buy
- AliExpress Refund Guide — how to get your money back when something goes wrong
- Is AliExpress Legit? — platform safety, buyer protection, and how to vet sellers
Disclosure: This article is published by the AliShopping Tools team. We describe our own extension's price history feature and honestly compare it to AliTools, a competing extension. The 90-day price tracking data reflects the current capabilities of AliShopping Tools as of July 2026. If you notice anything out of date, let us know at our contact page.
Ready to find winning products?
Try AliShopping Tools — 15 free AI tools for product research.
Quick answers
Frequently Asked Questions
1Does AliExpress show price history?
No.
AliExpress does not display price history natively.
The platform only shows the current price and the seller-set 'original price,' with no timeline of past prices.
To see a price chart on any AliExpress product, you need a third-party price tracker extension like AliShopping Tools or AliTools.
2How far back does AliExpress price history go with AliShopping Tools?
AliShopping Tools shows up to 90 days of price history for most AliExpress products.
New listings or low-traffic products may have a shorter history if they have not been tracked long enough.
Products with higher visibility on AliExpress (bestsellers, trending items, high search volume categories) typically have the full 90-day data available.
3Is the AliExpress price tracker free?
Yes.
The price history feature in AliShopping Tools is completely free.
There is no premium tier, no trial period, and no account creation required for the price history chart.
Install the extension and the chart appears automatically on AliExpress product pages.
4Can I check AliExpress price history on my phone?
The price history chart is a Chrome extension feature, so it runs on desktop Chrome — not inside the AliExpress mobile app or mobile browsers.
To check a product's price history from your phone, you can open the AliExpress desktop site in Chrome using the 'Request desktop site' option, though the chart is easier to read on a full-size screen.
5Does the price chart include shipping costs?
No.
The price chart tracks the item's listed price only.
Shipping costs are not included in the historical data because shipping rates vary by destination, carrier, and ongoing promotions — including them would distort the trend line.
If you want the total landed cost, add the current shipping estimate manually when comparing against the chart's baseline.
6How can I tell if an AliExpress discount is fake?
Check the product's price history chart.
If the price was stable for weeks and then spiked up right before the sale event, followed by a 'discount' that brings it back to roughly the same level, the discount is manufactured.
A genuine discount shows the current price dropping below the product's baseline (median) price on the chart.
The 90-day view makes this pattern immediately visible.
More from the blog
AliExpress Price History Checker 2026: How to See If a Sale Price Is Real
AliExpress doesn't show price history natively. This guide shows how to check the 90-day price chart on any AliExpress product — to know if the 'sale price' is real or an inflated fake before you buy.
Is This AliExpress Sale Real? The Free Way to Check Price History (2026)
That '70% OFF, ends tonight' banner is doing a lot of work — and most of it isn't for you. Here's the one check that tells you whether an AliExpress discount is real, in ten seconds, free.
AliShopping vs AliTools vs AliPrice 2026: Honest Extension Comparison
A fair 3-way comparison of the most popular AliExpress Chrome extensions — AliShopping Tools, AliTools, and AliPrice. Features, pricing, strengths, and honest trade-offs for buyers and dropshippers.