
How to Identify Saturated AliExpress Products 2026 — Stop Wasting Ad Spend
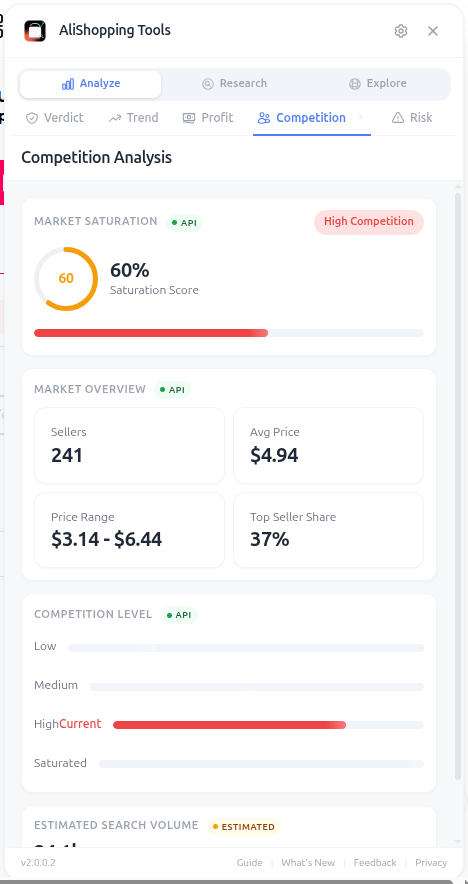
Quick answer: A dropshipping product is saturated when it shows 15+ active Facebook Ad Library advertisers, identical product photos across multiple Shopify stores, a declining Google Trends curve over the past 3–6 months, and Amazon Prime availability for the same item — products scoring above 65% on a saturation scale should be skipped unless you have a structural cost or audience advantage.
The Real Cost of Selling Saturated Products
Saturation is the silent budget killer in dropshipping. A product that generated six-figure revenues for early movers can become a money pit for latecomers within weeks. The advertising costs climb, the margins shrink, and customers who have already seen the same product from five different stores start ignoring your ads entirely.
Industry observations suggest that products reaching peak saturation often see customer acquisition costs climb significantly -- sometimes several times higher than early-stage performance. A product that cost $8 to acquire a customer for in month one might cost $25 or more by month three as more advertisers compete for the same audience, eroding profitability for latecomers.
This guide gives you a systematic framework for measuring saturation before you invest money in inventory, ads, or store setup. Saturation analysis is a key part of the competition assessment stage -- for the complete research workflow from product discovery through launch, see our Complete Dropshipping Product Research Guide.
Saturation thresholds at a glance
| Saturation score | Phase | Action |
|---|---|---|
| 0-30 percent | Discovery | Enter, ride the curve |
| 30-50 percent | Growth | Enter with strong differentiation |
| 50-65 percent | Growth-to-peak | Test small, prepare to exit |
| 65-80 percent | Peak | Skip unless you have a cost advantage |
| 80 plus percent | Decline / commoditised | Skip |
What Product Saturation Actually Means
Saturation is not a binary state. It exists on a spectrum, and understanding where a product falls on that spectrum determines whether it is still viable for your business.
A product becomes saturated when the number of sellers advertising it exceeds the audience's capacity to absorb new offers. This happens through a predictable cycle:
- Discovery phase: A few sellers identify a product with strong margins and demand. Advertising costs are low because competition is minimal.
- Growth phase: More sellers enter the market. Demand grows as audiences become aware of the product. Margins are still healthy.
- Peak phase: The product appears across social media feeds frequently. Many sellers compete for the same audience. Advertising costs rise sharply.
- Decline phase: Audience fatigue sets in. Click-through rates drop, return rates climb, and only sellers with the lowest costs or strongest brands remain profitable.
- Commoditization: The product becomes widely available on Amazon, in retail stores, or from dozens of competing Shopify stores. Margins compress to near zero for dropshippers.
Your goal is to catch products in the discovery or early growth phase and exit before peak saturation erodes your margins.
12 Signs a Product Is Already Saturated
1. Excessive Facebook Ad Library Results
Search for the product in the Meta Ad Library (facebook.com/ads/library). If you find more than 15-20 active ads from different advertisers for the same or nearly identical product, saturation is high. Pay attention to how many of these ads have been running for less than 30 days, since a flood of new advertisers entering simultaneously accelerates saturation.
2. Identical Product Listings on Multiple Shopify Stores
Search Google for the product name along with "powered by Shopify" or check common dropshipping store directories. Finding the same product with the same supplier photos on five or more stores indicates the market is crowded.
3. Declining Google Trends Interest
Pull up Google Trends for the product name and category. A downward trend over the past 3-6 months strongly suggests the product has passed its peak. Be careful to distinguish between seasonal dips and genuine decline by comparing year-over-year data.
4. Increased Supply-Side Competition
When a product succeeds, AliExpress suppliers respond by creating alternative versions at lower prices. If the original product listing sits alongside 20+ similar listings at varying price points, the supply side has caught up with demand.
5. Amazon Availability with Prime Shipping
Once a product appears on Amazon with Prime shipping and competitive pricing, the dropshipping model for that product is severely compromised. Customers who discover the same item on Amazon will almost always choose the faster shipping and trusted return policy.
6. High CPM in Your Target Audience
If you run test campaigns and see CPMs (cost per thousand impressions) above $30-40 in US/UK markets for a product category, multiple advertisers are bidding on the same audience. While high CPMs can have other causes, they frequently correlate with product-level saturation.
7. Comment Sections Full of Complaints
Read the comments on competitor ads. When you see patterns like "I already bought this and it broke," "I've seen this ad 100 times," or "You can get this on Amazon for $10," audience fatigue has set in.
8. TikTok Organic Saturation
Search for the product on TikTok. If dozens of creators have already made review videos, unboxings, or "TikTok made me buy it" content, the organic discovery phase is over. Products that go viral on TikTok typically have a 4-8 week window before saturation kills margins.
9. YouTube Review Coverage
When established YouTube reviewers have covered a product, a large portion of potential buyers will find those reviews before your store. If reviews are mixed or negative, this compounds the problem.
10. Razor-Thin Margins After Shipping
Calculate the actual landed cost: product cost + shipping + payment processing fees + estimated return rate. If the remaining margin after these costs leaves less than $10 profit per unit (or less than 30% margin), there is no room to absorb the higher advertising costs that come with competition.
11. Supplier Price Increases
When a product gets popular among dropshippers, AliExpress suppliers often raise prices. Compare the current supplier price against archived listings or alternative suppliers. A price increase of 20% or more in recent months suggests high demand from resellers.
12. Retargeting Frequency
Browse products in your target niche for a few days and pay attention to how often you see retargeting ads for similar products. If your feed fills up with variations of the same product from different stores, the audience is being hammered with ads.
Quantitative Saturation Analysis
Gut feeling is not enough. Here is how to put numbers behind your saturation assessment.
Competition Density Score
Create a simple scoring system based on observable data:
- Meta Ad Library active ads: 0-5 (low), 6-15 (moderate), 16+ (high)
- Google Shopping results: 0-10 (low), 11-30 (moderate), 31+ (high)
- AliExpress similar listings: 0-20 (low), 21-50 (moderate), 51+ (high)
- TikTok organic videos (last 30 days): 0-10 (low), 11-30 (moderate), 31+ (high)
Score each dimension as 1 (low), 2 (moderate), or 3 (high). A total score of 4-5 suggests manageable competition. Scores of 8-12 indicate significant saturation.
Margin Erosion Calculator
Track these numbers for any product you are considering:
- Supplier cost: The landed cost from your chosen supplier
- Target selling price: Based on competitor pricing analysis
- Shipping cost: Either absorbed or charged to customer
- Payment processing: Typically 2.9% + $0.30 per transaction
- Estimated return rate: 5-15% depending on category
- Customer acquisition cost: Based on test campaigns or industry benchmarks
If the customer acquisition cost at current competition levels exceeds 40% of your selling price, the product is likely too saturated to be profitable through paid advertising.
Trend Velocity Analysis
Google Trends provides a relative interest score from 0-100. Track the product's trend score at these intervals:
- Current score vs. 3 months ago: A drop of 20+ points signals rapid decline
- Current score vs. peak: If the current score is less than 50% of the peak, the product is in the decline phase
- Year-over-year comparison: Eliminates seasonal effects and reveals the true trajectory
How to Find Less Competitive Alternatives
Identifying saturation is only half the battle. The real skill is finding adjacent opportunities that capture similar demand with less competition.
The Variation Strategy
Instead of selling the exact product everyone else sells, look for variations:
- Different material or finish. If everyone sells the plastic version, find a bamboo or metal alternative.
- Bundle opportunities. Combine the saturated product with complementary items to create a unique offer.
- Niche-specific versions. A generic phone stand is saturated. A phone stand designed specifically for kitchen recipe viewing is not.
- Upgraded features. If the standard version lacks a feature customers complain about in reviews, find a supplier that has addressed that gap.
The Adjacent Niche Strategy
Saturated products reveal proven demand. Use that signal to explore adjacent categories:
- If LED strip lights are saturated, consider LED light panels, neon signs, or smart bulbs.
- If posture correctors are saturated, look at ergonomic accessories, standing desk converters, or lumbar support cushions.
- If pet cameras are saturated, explore automatic feeders, GPS trackers, or pet health monitors.
The key is to follow the customer intent rather than the specific product. People buying posture correctors want to reduce back pain. That core need can be addressed by many different products. Tracking what competitors launch in adjacent categories is a reliable way to spot these opportunities early -- our guide on how to track competitor products covers the workflow.
The Geographic Strategy
A product saturated in the US market may have minimal competition in Germany, Australia, or Scandinavia. Expanding to markets where the product has not yet peaked can extend its profitable lifespan. This requires localized marketing, translated product pages, and understanding of local shipping logistics, but the reduced competition often justifies the effort.
The Platform Strategy
If a product is saturated on Facebook and Instagram, it may still be underexploited on Pinterest, Snapchat, or Google Shopping. Different platforms reach different audiences, and advertising costs vary significantly across channels for the same product.
Timing Your Market Entry
Even with a product that shows moderate saturation, timing your entry correctly can make the difference between profit and loss.
Seasonal Windows
Products tied to seasonal events (summer gadgets, holiday gifts, back-to-school items) experience cyclical saturation. Competition peaks in the weeks before the season and drops off afterward. The optimal entry point is 6-8 weeks before peak season, when demand is rising but competition has not yet reached maximum intensity.
Trend Rebounding
Some products experience renewed interest after an initial saturation cycle. This can happen when a product goes viral again on a different platform, when a celebrity endorsement creates new demand, or when a new variation of the product enters the market. Monitor Google Trends for products that show a "W" pattern, where interest dips and then recovers.
Using Data Tools to Accelerate Saturation Analysis
Manually checking the Meta Ad Library, Google Trends, AliExpress listings, and competitor stores for every product candidate is thorough but slow. When you are evaluating dozens of potential products, the research hours add up quickly.
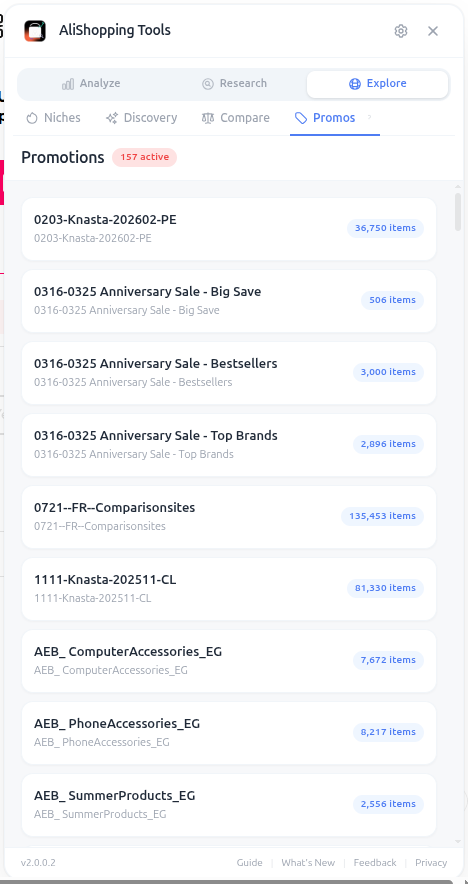
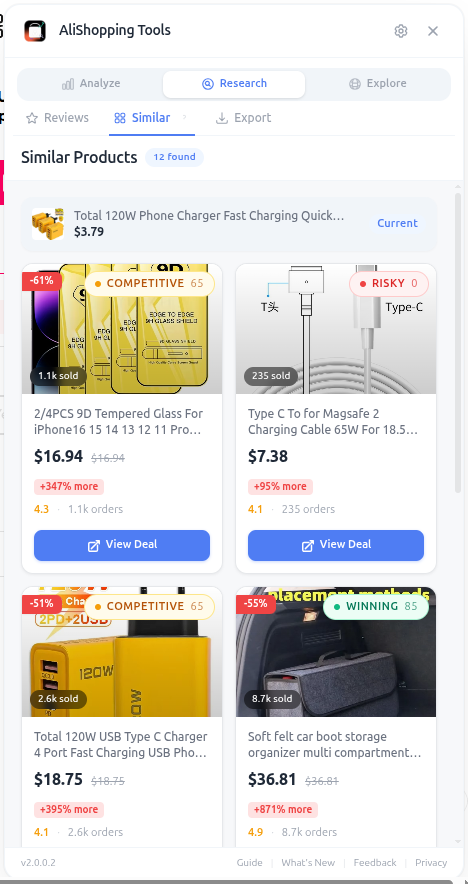
You can perform all of this analysis by hand. The ASTools Chrome Extension can speed up the supplier evaluation step by surfacing winning scores and risk assessments directly on AliExpress product pages, letting you filter out poor-quality suppliers before investing time in deeper saturation research.
Building a Saturation-Resistant Business
Avoiding saturated products is reactive. Building a business that withstands saturation is proactive. Three levers matter most:
Brand over commodity. Products are easy to copy; brands are not. Custom packaging, professional photography, and a distinctive store identity create a moat that protects margins even when competitors sell identical items. If you are still finding your niche, our guide on how to find profitable dropshipping niches covers positioning from the start.
Retention over acquisition. Repeat customers are significantly cheaper to convert than new ones. Email lists, loyalty programs, and genuine post-purchase follow-up reduce your dependence on paid acquisition -- the channel most affected by product saturation.
Portfolio over single-product dependence. Maintain 10-20 active products across different lifecycle stages. When one product enters saturation, others fill the gap. Use a structured competition analysis process to evaluate replacements before you need them urgently.
Saturation Assessment Checklist
Before committing budget to any product, run through this quick assessment:
- Fewer than 15 active ads in Meta Ad Library
- Google Trends stable or growing over past 3 months
- Not available on Amazon with Prime shipping at a competitive price
- Fewer than 5 competing Shopify stores selling the identical item
- Margin of at least $15 per unit after all costs at current competitor pricing
- No signs of audience fatigue in competitor ad comments
- At least one clear differentiation angle available (variation, bundle, niche focus)
- Viable marketing channel with reasonable CPM for the target audience
Products that pass six or more of these checks are worth testing. Products that fail four or more should be deprioritized unless you have a strong differentiation strategy.
Saturation awareness is not about avoiding competition entirely -- some competition validates a market. It is about entering at the right lifecycle stage and knowing when to pivot. Build the checklist above into your product evaluation routine, and you will consistently avoid the products that drain budgets while catching the ones that still have room to grow.
Frequently Asked Questions
Can a saturated product still be profitable?
Yes, but only under specific conditions. If you have a strong brand, a differentiated version of the product (better material, unique bundle, or niche-specific variant), or access to a cheaper traffic source than competitors, saturation matters less. Generic dropshippers selling the identical product at similar prices will struggle.
How quickly does a product typically go from discovery to saturation?
It depends on the product's viral potential. Products that spread through TikTok or Facebook ads can move from discovery to peak saturation in 4-8 weeks. Products with steadier organic demand may take 3-6 months. Monitor the 12 signs listed above to track where a product sits on the lifecycle.
Is low competition always a good sign?
Not necessarily. Low competition can mean low demand rather than an untapped opportunity. Always cross-reference competition levels with demand signals (search volume, AliExpress order counts, Amazon BSR). A product with zero competitors and zero search volume is not a hidden gem -- it is a dead market. For a full framework, see our guide on how to find profitable dropshipping niches.
Should I exit a product as soon as I see saturation signals?
Not immediately. Early saturation signals (rising ad count, new competitors entering) are a warning to start looking for replacements, not to panic-exit. Monitor your own metrics -- cost per acquisition, return rate, and profit per unit. Exit when your margins fall below your minimum threshold, not when you see the first sign of competition.
Ready to find winning products?
Try AliShopping Tools — 15 free AI tools for product research.
Quick answers
Frequently Asked Questions
1What is the lifecycle a product follows before becoming saturated?
Five phases per the post: Discovery (few sellers identify a product with strong margins and demand — advertising costs low because competition minimal), Growth (more sellers enter, demand grows as audiences become aware, margins still healthy), Peak (product appears frequently on social feeds, many sellers compete for same audience, ad costs rise sharply), Decline (audience fatigue, CTR drops, return rates climb, only lowest-cost or strongest-brand sellers stay profitable), and Commoditization (widely available on Amazon and retail, margins compress to near zero for dropshippers).
Your goal is catching products in Discovery or early Growth and exiting before peak.
2What Facebook Ad Library threshold indicates saturation?
Per the post, more than 15–20 active ads from different advertisers for the same or nearly identical product indicates high saturation.
Pay attention to how many have been running less than 30 days — a flood of new advertisers entering simultaneously accelerates saturation dramatically.
This is one of the most concrete saturation signals because Ad Library is public, searchable by country, and filterable by date, so you can reproduce the count directly.
3What CPM range suggests a product category is saturated?
If test campaigns show CPMs above $30–$40 in US/UK markets for a product category, multiple advertisers are bidding on the same audience.
While high CPMs can have other causes, they frequently correlate with product-level saturation.
Combined with other signals — Facebook Ad Library counts, Amazon Prime availability, declining Google Trends, identical Shopify listings — a high-CPM category usually has late-entry economics stacked against you.
4How do I calculate the 12‑signal saturation score for an AliExpress product?
You calculate the saturation score by assigning each of the 12 measurable signals a weight of 5 % and summing the results; a product that hits 13 out of 12 signals scores 65 %.
For example, 10 active Facebook advertisers (5 %), identical images on 4 Shopify stores (5 %), a 35 % drop in Google Trends over the last 4 months (5 %), and 22 competing AliExpress listings (5 %) would already total 20 %.
Continue adding points for Amazon Prime presence, CPMs above $30, comment‑section sentiment, and TikTok creator volume.
Anything above a 65 % threshold should be avoided unless you have a unique cost advantage.
Use AliShopping Tools to automate the weighting and generate a quick saturation index.
5What Google Trends decline percentage over three to six months signals that a product is becoming saturated?
A decline of 30 % or more in Google Trends over a 3‑month window is a strong early warning that a product is reaching saturation.
If the search interest falls from 80 to 55 or lower between March and June, the downward momentum suggests consumer fatigue.
A slower drop—10‑15 %—can be acceptable if other signals remain low, but a sharp 30 %+ dip combined with rising CPMs usually means the market is closing.
Track the trend weekly in the Google Trends dashboard and set an alert at the 30 % threshold to pause ad spend before costs spiral.
6Why do identical product photos across multiple Shopify stores matter, and how can I spot them fast?
Identical product photos indicate that many dropshippers are copying the same supplier listing, which drives price wars and reduces profit margins.
If you find the same image on five or more Shopify stores, the product is likely saturated.
The quickest way to spot this is to use a reverse‑image search (Google Images or TinEye) on the main product photo from AliExpress, then scan the first 20 results for Shopify domains.
AliShopping Tools also offers a bulk image‑matching feature that flags duplicate visuals across competitor stores, letting you decide whether the niche is still viable.
7How does Amazon Prime availability serve as a saturation indicator for an AliExpress product, and what steps should I take to verify it?
If the exact same item appears on Amazon with Prime shipping, it signals that the product has already been sourced by larger retailers, increasing competition and reducing ad efficiency.
To verify, copy the primary product title from AliExpress and add "Prime" in the Amazon search bar; a matching SKU with the Prime badge confirms saturation.
Check the number of Prime sellers—more than three usually means the market is crowded.
Document the Amazon price point and compare it to your planned retail price; a narrow margin often forces you to abandon the product unless you have a unique branding edge.
8What CPM differential between the US and UK markets is acceptable before I consider a product saturated?
A safe CPM differential is under $5 between the US and UK markets; for example, $28 in the US and $23 in the UK suggests healthy demand.
When US CPM climbs above $40 and UK CPM exceeds $35, the gap widens to $10‑15, indicating that advertisers are competing heavily and the audience is fatigued.
Monitor CPMs daily in your ad platform and set an alert when the US CPM surpasses $30 while the UK CPM stays below $25, as this imbalance often precedes a broader saturation spike.
Consistently high CPMs across both regions usually warrant pausing the campaign and scouting a new product.
More from the blog
How to Measure Competition in a Dropshipping Niche (4-Signal Framework)
Seller count alone lies. Learn the 4 real signals that reveal true dropshipping niche competition — review velocity, price compression, ad saturation, and supplier concentration — plus a Competition Score framework to make faster go/no-go decisions.
21 min read
How to Choose a Dropshipping Niche in 2026: The Complete Decision Guide
How to choose a dropshipping niche in 2026: the 4-criteria framework (demand, competition, margins, passion), 5 niches that still work, 3 niches to avoid, and a 48-hour validation checklist. No guru opinions — just repeatable process.
14 min read
5 'Winning' Products That Are Actually Losing Money in Q2 2026
5 'winning' products that saturate fast for new entrants in Q2 2026 — why late entry loses money, and how to verify competition before you spend a dollar.
12 min read