What is the difference between perceived and actual product demand?
Per the post, a viral TikTok with millions of views is entertainment — it does not equal buying intent.
Perceived demand is based on social buzz, trend articles, and anecdotal evidence and leads dropshippers to gamble.
Actual demand is measurable through concrete data points: search volume, order velocity, price sensitivity, and repeat purchase behavior.
Building a business on verified demand is strategy; building on perceived demand is gambling.
2
How do I interpret a Google Trends score correctly?
Google Trends shows relative interest, not absolute volume — a score of 100 means peak interest for that term in the selected timeframe, not 100 searches.
Pair it with absolute search volume from a keyword tool.
The post's key metrics to extract: current interest relative to 12-month peak (80% is healthy, 30% means decline), trend direction over 90 days (rising is ideal for emerging, flat acceptable for established, declining is a warning), and seasonal patterns compared across years.
A sudden spike that rapidly declines is a viral moment, not sustainable demand.
3
Why can a product with a "50" Google Trends score still be misleading?
Because comparing two products with very different search volumes can mislead — a 50 might mean 500 monthly searches in a niche category or 500,000 in a mainstream one.
The relative trend matters but context matters more.
Regional interest variations also distort results: a product trending strongly in California but flat everywhere else has a smaller addressable market than the trend line suggests.
Always filter category and geography, and always pair Trends with keyword-tool volume data.
4
How can I use order velocity on AliExpress to predict weekly sales for a new product?
Order velocity is a proxy: a rising order count over the past 30 days on AliExpress suggests real, ongoing demand rather than a one-off spike.
Rather than trusting one exact conversion ratio, watch the trend across several weeks — steady or rising velocity is a stronger signal than any single day's count.
Cross-check against a stable or rising Google Trends line over the same period; if Trends is flat but orders spike, treat the product as short-term hype rather than sustainable demand.
5
What threshold of social media engagement indicates a viable product niche on TikTok and Instagram?
There's no fixed pass/fail threshold — look for organic engagement (likes, comments, shares) that's clearly growing week over week rather than a single one-off viral post, and check that comments reflect genuine buying intent ("where do I buy this") rather than just entertainment reactions.
Strong, sustained social engagement is a useful supporting signal, best combined with Google Trends and AliExpress order velocity rather than relied on alone.
6
How do I combine Google Trends, keyword search volume, and AliExpress order data into a single demand score?
There's no single official formula — treat Google Trends, keyword search volume, and AliExpress order data as three independent checks rather than trying to compress them into one precise score.
A product that looks strong on all three (rising Trends, decent search volume, growing orders) is a much safer bet than one that only looks good on one metric.
Re-check the three signals periodically rather than relying on a one-time snapshot.
7
When is the best time of year to launch a seasonal product found on AliExpress, based on historical demand patterns?
Aim to launch several weeks ahead of the season's typical demand ramp, using the past year or two of Google Trends and AliExpress order data for that category to spot when interest historically starts climbing.
The exact lead time varies by product and season, so use historical trend data for that specific niche rather than a fixed rule.
Pairing early launch timing with a pre-launch marketing push helps you capture buyers before the peak gets crowded.
8
Can competitor ad density on platforms like Facebook reliably filter out low‑demand products, and what density ratio should I look for?
Competitor ad volume is a useful signal, not a precise filter — a keyword with very heavy paid competition relative to the number of AliExpress listings for it often signals a saturated or already-validated niche, while very light ad presence combined with decent search/order data can point to an under-served opportunity.
Treat ad density as one input alongside order velocity and social signals rather than a standalone pass/fail ratio.
Quick answer: Validate product demand by cross-referencing at least three independent signals — rising Google Trends direction over 90 days, at least 5,000 monthly searches for the primary keyword, and accelerating AliExpress order velocity — before committing any ad budget to a product.
The 6 demand signals at a glance
Method
Signal it measures
Pass threshold
Google Trends
Direction of interest (90 days)
Rising or stable, ≥80% of 12-month peak
Search volume
Absolute monthly demand
5,000+ searches on primary keyword
Social signals
Early buying intent
"Where to buy" comments + 1–10M hashtag views
AliExpress order velocity
Recent transaction demand
Accelerating orders in last 30 days
Competitor ad density
Proven profitability
Ads running 60+ days, multiple variations
Seasonality
Demand durability
Evergreen or growing year-over-year peaks
A product that scores strongly on four or more of these signals has validated demand; one or two alone is speculation.
What Is the Difference Between Perceived and Actual Demand?
A product that looks popular is not the same as a product people are actively buying. This distinction trips up dropshippers constantly. They see a viral TikTok video with millions of views and assume the product must be selling well. But views do not equal purchases. Entertainment does not equal buying intent.
Actual demand is measurable through concrete data points: search volume, order velocity, price sensitivity, and repeat purchase behavior. Perceived demand is based on social buzz, trend articles, and anecdotal evidence. Building a business on perceived demand is gambling. Building on verified demand is strategy. Demand analysis is one piece of a seven-step research process -- our Complete Dropshipping Product Research Guide shows how it connects to competition analysis, supplier evaluation, and profitability testing.
This guide covers six distinct methods for measuring real product demand, with specific tools, thresholds, and interpretation frameworks for each.
Method 1: Google Trends Analysis
Google Trends is the most accessible and underutilized demand analysis tool available. It measures relative search interest over time, which directly correlates with consumer awareness and buying intent.
How to Use Google Trends Effectively
Start by entering the product name as a search term. Set the geography to your target market (United States, worldwide, or a specific country) and the timeframe to the past 12 months for recent trajectory, then expand to 5 years for historical context.
Key metrics to extract:
Current interest level relative to peak: A product at 80% of its 12-month peak is in a healthy position. A product at 30% of its peak is in decline.
Trend direction over the past 90 days: Rising, flat, or declining. Flat is acceptable for established categories. Rising is ideal for emerging products. Declining is a warning.
Seasonal patterns: Compare the same months across multiple years. Some products show predictable spikes (heated blankets in October, outdoor furniture in April) that you can plan around.
Interpreting the Data Correctly
Google Trends shows relative interest, not absolute volume. A score of 100 means peak interest for that term in the selected timeframe, not 100 searches. Always pair Google Trends with absolute search volume data from keyword research tools.
Common misinterpretations to avoid:
A sudden spike followed by a rapid decline usually indicates a viral moment, not sustainable demand. Products that spike and stabilize at a higher baseline than before the spike are genuine winners.
Comparing two products with very different search volumes can be misleading. A product with a "50" on Google Trends might represent 500 monthly searches if the category is niche, or 500,000 if the category is mainstream. The relative trend matters, but context matters more.
Regional interest variations can dramatically affect your results. A product trending strongly in California but flat everywhere else has a smaller addressable market than the trend line suggests.
Advanced Google Trends Techniques
Related queries: Scroll down to the "Related queries" section and look at "Rising" queries. These reveal emerging variations and use cases that may represent less competitive entry points.
Compare terms: Enter your product alongside 2-3 alternatives or competing products. This shows relative demand between options and can help you choose which product to prioritize.
Category filtering: Narrow your search to a specific Google Trends category to filter out irrelevant searches. For example, searching "apple" in the "Food & Drink" category eliminates Apple Inc. related searches.
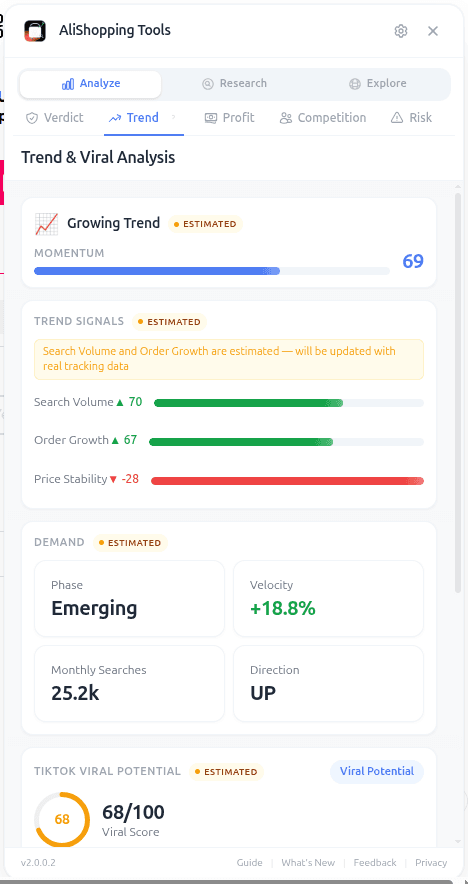
Trend classification (Emerging/Growing/Peak/Declining) paired with Google Trends gives you direction plus volume.
Method 2: Search Volume and Keyword Research
While Google Trends shows direction, keyword research tools provide absolute numbers. These numbers tell you how many people are actively searching for your product each month.
Tools and Their Strengths
Google Keyword Planner (free with Google Ads account): Provides search volume ranges and competition levels. Most useful for understanding commercial intent keywords.
Ubersuggest (free tier available): Shows search volume, SEO difficulty, and related keyword suggestions. Good for identifying long-tail opportunities.
Ahrefs or SEMrush (paid): Offer the most accurate search volume data, click-through rate estimates, and competitive analysis. Worth the investment if product research is a regular activity.
What Search Volume Tells You
Search volume for product-specific keywords directly measures active buying interest. Focus on these keyword types:
Product name keywords: "posture corrector," "LED strip lights," "portable blender"
Combined long-tail keywords: 10,000+ across all variations suggests a robust market
Keyword Demand Mapping
Create a simple spreadsheet that maps the demand landscape:
Keyword
Monthly Volume
Competition
CPC
Intent
[product name]
12,000
Medium
$1.20
Informational/Commercial
best [product]
3,400
High
$2.50
Commercial
buy [product] online
1,800
High
$3.10
Transactional
[product] for [use case]
800
Low
$0.80
Commercial
This map reveals not just total demand but also how competitive different angles are. Low-competition, moderate-volume keywords represent the easiest market entry points.
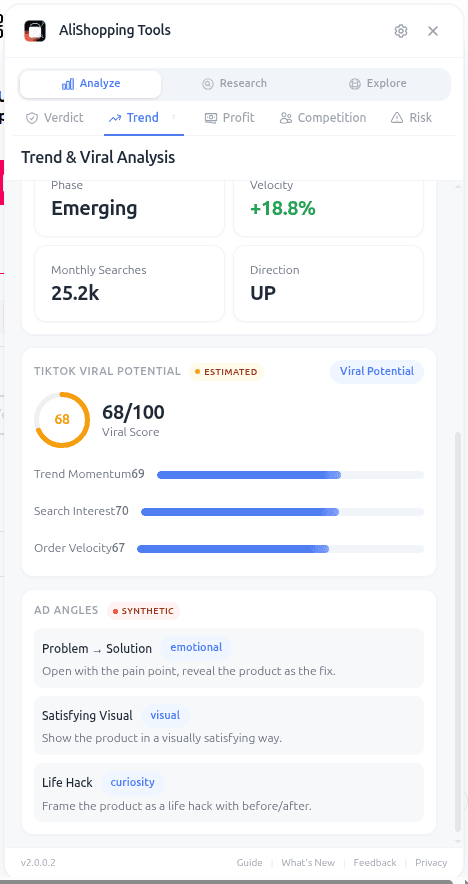
TikTok Viral Score complements search-volume data by capturing social-first demand signals.
Method 3: Social Media Demand Signals
Social platforms provide real-time demand signals that often precede search volume changes by 2-4 weeks. A product generating buzz on TikTok today will show up in Google search data next month.
TikTok Demand Analysis
TikTok has become the primary product discovery engine for consumers under 35. For a complete TikTok-specific approach, see our guide to finding trending TikTok products. Here is how to extract demand signals:
Search the product name and sort by most recent. Look at the posting frequency: are new videos appearing daily, weekly, or sporadically?
Check the hashtag volume. Products with dedicated hashtags exceeding 10 million views have significant awareness. Hashtags between 1-10 million views represent the growth sweet spot.
Evaluate comment sentiment. Read the comments on product-related videos. "Where can I buy this?" and "Link please" comments indicate genuine purchase intent. "Cool" and "Wow" comments indicate entertainment value but weaker buying intent.
Track creator diversity. If content comes from many different creators (not just a few sponsored posts), interest is organic rather than manufactured.
Instagram and Pinterest Signals
Instagram is more relevant for lifestyle, fashion, and home decor products. Pinterest is a strong signal for seasonal, DIY, and aspirational products.
Instagram indicators:
Explore page presence for product-related hashtags
User-generated content volume (customers posting about the product, not just influencers)
Engagement rate on product-focused posts (above 3% suggests strong resonance)
Pinterest indicators:
Monthly search volume for the product term (available through Pinterest Trends)
Pin save rates (high saves indicate future purchase intent)
Seasonal trend data (Pinterest users often plan purchases weeks or months in advance)
Reddit and Forum Signals
Niche forums and subreddits provide unfiltered consumer opinions that are harder to find on commercial platforms.
Search relevant subreddits for the product name. Threads asking "is [product] worth it?" or "anyone tried [product]?" indicate active consideration.
Pay attention to complaint patterns. Recurring frustrations with existing solutions in a category signal opportunity for a better product.
Look for recommendation threads. When users organically recommend a product to others, that is the strongest possible demand signal.
How Do You Read AliExpress Order Velocity? (Method 4)
Order counts on AliExpress provide a direct measure of transaction-level demand. However, interpreting these numbers requires context.
Reading Order Data Accurately
AliExpress shows total orders on each listing. More useful than the total is the trajectory:
Recent orders (last 30 days): This is the most relevant metric. A product with 10,000 total orders but only 50 in the last month is declining. A product with 2,000 total orders and 400 in the last month is surging.
Multiple listings for the same product: If 10 different suppliers each show 1,000+ orders, total market demand is significant and distributed, which is generally positive.
Review-to-order ratio: AliExpress reviews typically represent 5-15% of total orders. A listing with 3,000 orders and 600 reviews (20% ratio) may have inflated order counts.
Cross-Referencing Supplier Data
Do not rely on a single listing. Search for the same product across multiple suppliers and aggregate the data:
Total orders across all listings for the product
Average star rating across listings
Price range across suppliers (indicates margin potential)
Number of active sellers (indicates supplier-side competition)
Aggregating this data manually across dozens of listings is time-consuming. The free ASTools Chrome Extension overlays order velocity, winning scores, and risk indicators directly on AliExpress search results, letting you compare supplier-level demand signals side-by-side without switching between tabs.
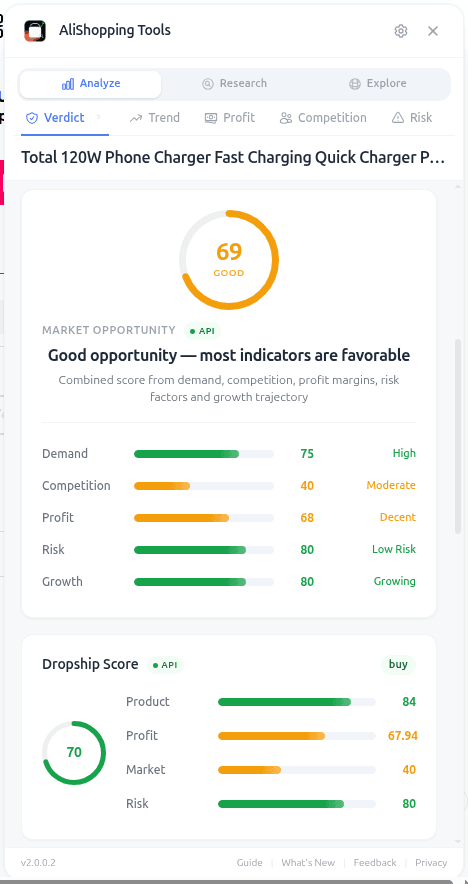
Order velocity, recent sales, and winning scores surface inline while you browse AliExpress.
Method 5: Competitive Demand Proxy
Sometimes the best way to gauge demand is to analyze how much competitors are investing in selling a product. The Meta Ad Library reveals which products have active, long-running campaigns. An ad running for 60+ days is almost certainly profitable. Multiple ad variations from the same brand indicate heavy investment, and ads running in multiple countries suggest broad demand. For a thorough competitive analysis framework, see our competition analysis guide.
Method 6: Seasonal Pattern Analysis
Ignoring seasonality is one of the most expensive mistakes in product research. A product that looks promising in October might be dead by January if its demand is holiday-driven.
Identifying Seasonal Products
Use Google Trends with a 5-year timeframe to spot cyclical patterns. Products fall into three categories:
Evergreen products: Consistent demand year-round with minor fluctuations (phone accessories, kitchen gadgets, pet supplies). These are the safest for building a sustainable business.
Seasonal products: Predictable demand spikes tied to calendar events (swimwear in spring, heating products in fall, gift items in November-December). These can be highly profitable if timed correctly but require careful inventory and cash flow management.
Trend products: One-time demand spikes driven by viral moments, celebrity endorsements, or news events. These are the highest risk because the window of profitability is narrow and unpredictable.
Planning Around Seasonal Demand
For seasonal products, your timeline matters enormously:
Start advertising 4-6 weeks before the seasonal peak. This lets you build pixel data and optimize campaigns before competition intensifies.
Scale spending as demand rises. Increase daily budgets proportionally to the rising trend line.
Prepare to exit 2 weeks before the seasonal decline. Reduce spend gradually as demand wanes rather than cutting off abruptly.
Account for shipping times. If your supplier ships in 15-20 days, orders placed after early December will not arrive before Christmas, regardless of how strong the demand signal looks.
Year-Over-Year Trend Comparison
The most reliable demand indicator is whether peak season interest is growing or shrinking each year:
Growing peaks: Each year's seasonal spike is higher than the previous year. This indicates an expanding market.
Stable peaks: Consistent height across years. The market is mature but reliable.
Declining peaks: Each year's spike is lower than the last. The product category is losing relevance regardless of seasonal timing.
How Much Demand Is Enough to Validate a Product?
Combine all six methods into a single demand assessment for every product candidate:
Google Trends direction: Rising, stable, or declining
Monthly search volume: Specific number for primary and related keywords
Social media buzz: Quantified engagement across relevant platforms
AliExpress order velocity: Current monthly orders across multiple listings
Competitor investment level: Number of active advertisers and ad longevity
Seasonal classification: Evergreen, seasonal, or trend-driven
A product that shows strong signals across four or more of these dimensions has validated demand. A product that only registers on one or two dimensions (such as a viral TikTok trend with no search volume) is a speculation, not a validated opportunity. Once demand is confirmed, the next step is validating the product holistically before committing budget.
Demand Scoring Matrix
Rate each dimension on a 1-3 scale:
1 (Weak): Declining trends, low search volume, minimal social presence, few orders
2 (Moderate): Stable trends, reasonable search volume, some social activity, steady orders
3 (Strong): Rising trends, high search volume, active social engagement, high order velocity
Total the scores across all six dimensions:
15-18: Strong demand profile. Proceed to margin and competition analysis with confidence.
10-14: Moderate demand. Viable if competition is low and margins are strong.
6-9: Weak demand. High risk unless you have unique advantages (existing audience, proprietary product, niche expertise).
Common Demand Analysis Mistakes
Confusing Awareness with Intent
A product can have massive awareness (everyone knows what it is) but low buying intent (nobody is looking to buy one right now). Fidget spinners after their 2017 peak — or more recently, many viral TikTok gadgets — had high awareness and near-zero buying intent once the novelty wore off. Distinguish between these by focusing on transactional keywords and recent order data rather than social media mentions.
Ignoring Market Size Limitations
A product might show strong demand signals but in a market too small to support your revenue goals. A niche product with 2,000 monthly searches and a $30 price point has a theoretical maximum market size of $60,000 per month, split among all competitors. If there are already 10 sellers, your realistic share might be $3,000-6,000 monthly revenue. Determine whether that scale matches your objectives.
Overweighting a Single Data Source
No single data source tells the complete demand story. Google Trends can be noisy for low-volume products. AliExpress order counts can be inflated. Social media engagement can be manufactured. The power of multi-source analysis is that genuine demand shows up consistently across multiple independent data streams. When the signals align, your confidence should be high. When they contradict each other, dig deeper before committing.
Mistaking Supply for Demand
A large number of AliExpress suppliers offering a product means the supply side sees opportunity. It does not necessarily mean consumer demand justifies that supply. In fact, an oversupplied market with moderate demand is a worse position than a moderately supplied market with moderate demand. Always validate from the consumer side first, then check whether the supply dynamics support profitable entry.
Demand analysis is not a guarantee of success, but it is the closest thing to insurance that product research offers. Products with verified, multi-source demand signals fail for other reasons far less often than products chosen on instinct alone. Make demand validation the non-negotiable first step in every product evaluation, and you will eliminate the majority of potential failures before they cost you money.
Frequently Asked Questions
How much search volume is enough to validate a product?
For the US market, aim for at least 5,000 monthly searches for the primary product keyword and 1,000+ for buying-intent modifiers like "best [product]" or "buy [product]." However, search volume alone is not sufficient — pair it with at least one other demand signal (social engagement, AliExpress order velocity) for a reliable assessment.
Can a product with declining Google Trends still be profitable?
In some cases, yes. A product in gradual decline may still have enough residual demand to support a profitable store, especially if competition has also declined. However, building a long-term business on declining demand is risky. These products are better suited for short-term campaigns with defined exit points.
How do I tell the difference between a genuine trend and a viral fluke?
Look at the post-spike baseline. A genuine trend spikes and then stabilizes at a higher baseline than before — this means the product has found a sustained audience. A viral fluke spikes and returns to its previous level or lower. Check Google Trends with a 12-month view to see whether interest persists after the initial burst.
Should I prioritize Google Trends or AliExpress order data?
Use both, as they measure different things. Google Trends captures consumer awareness and intent in your target market, while AliExpress order data shows actual transaction volume on the supply side. The strongest signal is when both point in the same direction — rising search interest paired with accelerating order velocity.